Descriptive Statistics: The Mean
Summary
TLDRIn the first video of a descriptive statistics series, Justin Seltzer introduces the mean, explaining its calculation for both populations and samples. He demonstrates the process using a sample dataset, showing how to derive a weighted mean and how to handle categorical data by transforming it into numerical values. The video emphasizes the intuitive nature of these calculations and concludes with a challenge question related to weighted averages. Overall, it serves as an engaging entry point for beginners and seasoned statisticians alike, promoting deeper understanding of fundamental statistical concepts.
Takeaways
- 😀 The mean, derived from the French word 'moyen,' represents the average value in a dataset.
- 😀 The mean of a population is denoted by the Greek symbol mu (μ), while a sample uses a lowercase 'n' for the number of observations.
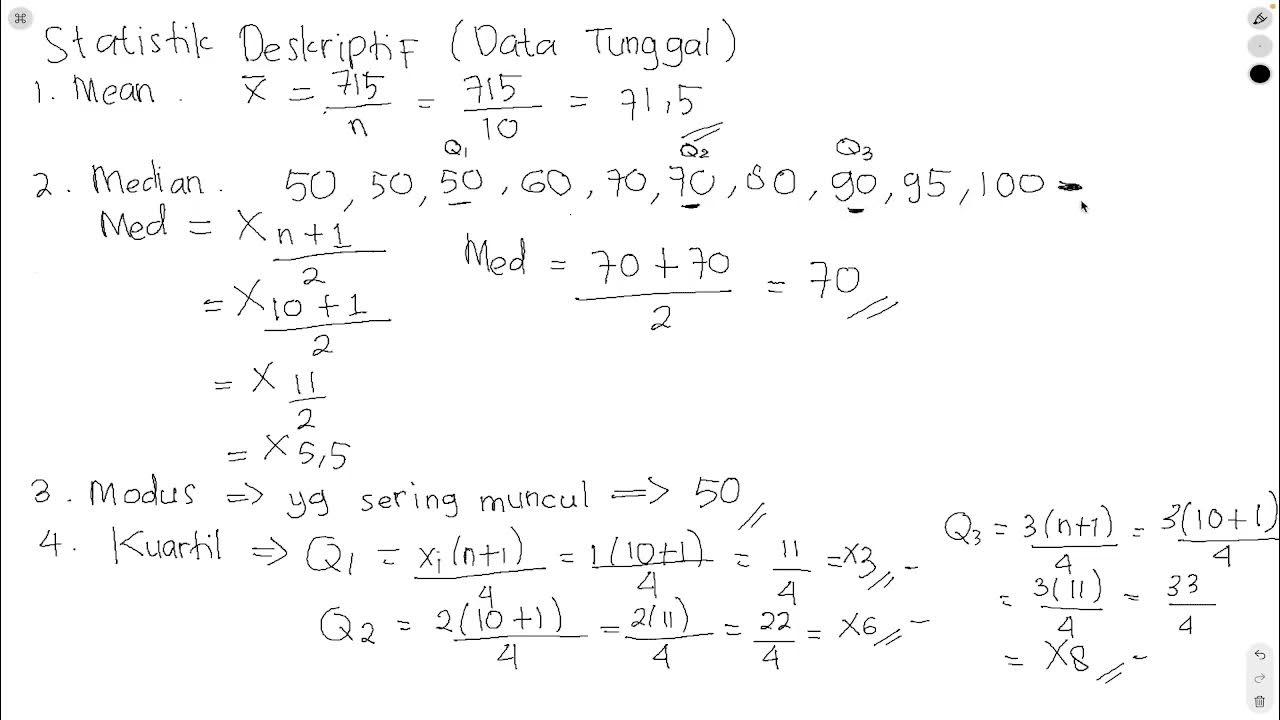
- 😀 To calculate the mean, sum all observations (Σx) and divide by the total number of observations (n).
- 😀 When calculating the mean, it's standard practice to present the result with one more decimal place than the original dataset.
- 😀 The weighted mean accounts for different frequencies of values, using the formula that incorporates these weights.
- 😀 A weighted mean is simply a regular mean where all weights are equal to one, emphasizing its intuitive nature.
- 😀 For categorical data, the mean can be calculated by converting categories to numerical values (e.g., 1 for female, 0 for male).
- 😀 The mean of a binary variable represents the proportion of one category (e.g., females in a dog litter).
- 😀 It's not advisable to apply the mean to categorical variables with more than two values, as it may not yield meaningful results.
- 😀 The video encourages viewers to engage with practical exercises, like calculating a weighted average mark based on credit points.
Q & A
What is the primary focus of the first video in the series?
-The first video focuses on the concept of the mean in descriptive statistics.
What historical origin does the word 'mean' have?
-The word 'mean' comes from the French 'moyen,' meaning the middle of two musical notes.
How is the mean symbolized in statistics?
-The mean from a population is symbolized by the Greek letter mu (μ).
What is the formula for calculating the mean from a population?
-The formula is the sum of all observations (ΣX) divided by the total number of observations (N).
How does the formula for the mean change when using a sample instead of a population?
-For a sample, the formula remains similar but uses a lowercase 'n' to represent the number of observations.
What is the weighted mean, and how is it calculated?
-The weighted mean considers the frequency of each observation, calculated by multiplying each value by its frequency, summing these products, and dividing by the total frequency.
Can you find the mean of a categorical variable?
-Yes, by converting categories into numerical values, such as assigning 1 for females and 0 for males, you can calculate a mean that represents proportions.
What does a mean of 0.6667 indicate in a binary variable context?
-It indicates that approximately 66.67% of the observations belong to the category defined as 1, which in this case represents females.
What is the challenge question presented in the video?
-The challenge question asks viewers to calculate Georgia's weighted average mark based on her statistics degree subjects and their credit points.
Where can viewers find more videos in the series?
-Viewers can find more videos on Z statistics.com, where additional descriptive statistics topics are covered.
Outlines

هذا القسم متوفر فقط للمشتركين. يرجى الترقية للوصول إلى هذه الميزة.
قم بالترقية الآنMindmap

هذا القسم متوفر فقط للمشتركين. يرجى الترقية للوصول إلى هذه الميزة.
قم بالترقية الآنKeywords

هذا القسم متوفر فقط للمشتركين. يرجى الترقية للوصول إلى هذه الميزة.
قم بالترقية الآنHighlights

هذا القسم متوفر فقط للمشتركين. يرجى الترقية للوصول إلى هذه الميزة.
قم بالترقية الآنTranscripts

هذا القسم متوفر فقط للمشتركين. يرجى الترقية للوصول إلى هذه الميزة.
قم بالترقية الآن5.0 / 5 (0 votes)


