Descriptive Statistics [Simply explained]
Summary
TLDRThis video explains descriptive statistics, focusing on four key components: measures of central tendency (mean, median, and mode), measures of dispersion (standard deviation, variance, range, and interquartile range), frequency tables, and charts. Descriptive statistics summarize data from surveys to provide insights into employee commuting methods. The presenter clarifies that while descriptive statistics describe data characteristics, they do not infer conclusions about broader populations. The video highlights the importance of visual representations like bar charts and frequency tables in making data easily interpretable, laying the groundwork for deeper statistical analysis.
Takeaways
- 😀 Descriptive statistics summarize and describe data without inferring conclusions about a larger population.
- 📊 Measures of central tendency include mean, median, and mode, which provide insights into the average and most common values in a dataset.
- 📈 The mean is calculated by summing all observations and dividing by the number of observations.
- 🔍 The median is the middle value in an ordered dataset and is resistant to extreme values or outliers.
- 📉 The mode refers to the most frequently occurring value(s) in a dataset and can be unimodal, bimodal, or multimodal.
- 🔢 Measures of dispersion, such as standard deviation and variance, describe how spread out the values in a dataset are.
- 📏 The standard deviation indicates the average distance of data points from the mean, while variance is the square of the standard deviation.
- 🌈 The range is the difference between the maximum and minimum values, while the interquartile range (IQR) represents the middle 50% of data.
- 🗃️ Frequency tables summarize how often each distinct value appears in a dataset, making data easier to understand.
- 📊 Contingency tables display relationships between two categorical variables, providing insights into their interactions.
Q & A
What is descriptive statistics?
-Descriptive statistics is a branch of statistics that summarizes and describes the main characteristics of a data set, providing a simple overview without drawing conclusions about a larger population.
What are the four key components of descriptive statistics?
-The four key components of descriptive statistics are measures of central tendency, measures of dispersion, frequency tables, and charts.
What are measures of central tendency, and what are some examples?
-Measures of central tendency are values that represent the center of a data set. Examples include the mean, median, and mode.
How is the mean calculated?
-The mean is calculated by summing all observations in a data set and then dividing by the number of observations.
What is the difference between the median and the mean?
-The median is the middle value in an ordered data set, while the mean is the average of all values. The median is resistant to outliers, meaning it is less affected by extreme values compared to the mean.
What does the mode represent in a data set?
-The mode is the value that appears most frequently in a data set. A data set can be unimodal (one mode), bimodal (two modes), or multimodal (multiple modes).
What are measures of dispersion, and why are they important?
-Measures of dispersion indicate how spread out the values in a data set are. They are important because they help understand the variability of the data, which complements the measures of central tendency.
How is standard deviation calculated?
-Standard deviation is calculated using the formula, where Sigma represents the standard deviation, n is the number of observations, x_i is each individual observation, and x̄ is the mean of all observations.
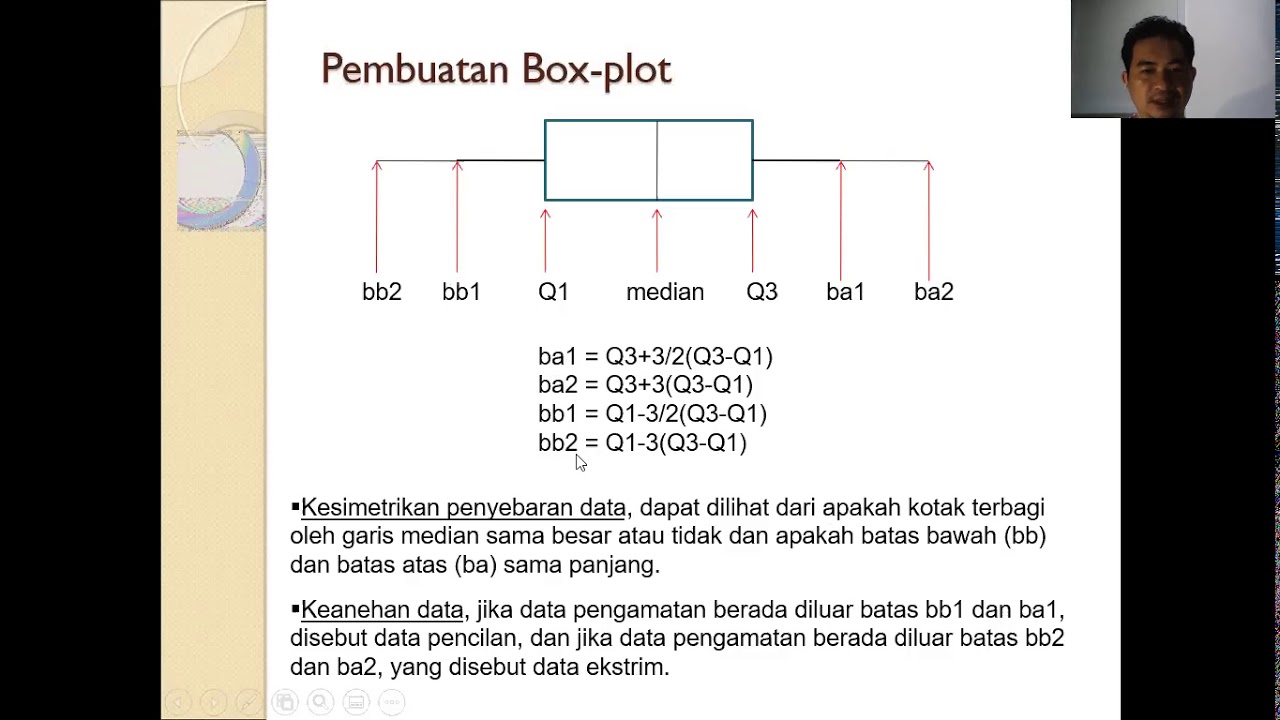
What is the interquartile range, and what does it represent?
-The interquartile range (IQR) is the difference between the third quartile (Q3) and the first quartile (Q1). It represents the range of the middle 50% of the data, effectively showing where the bulk of the values lie.
What is a frequency table, and how is it used?
-A frequency table displays how often each distinct value appears in a data set. It summarizes categorical data, making it easier to understand and analyze patterns.
What is a contingency table?
-A contingency table, or cross-tab, displays the relationship between two categorical variables. It allows for easy comparison of frequency counts across different categories.
What types of charts are useful for representing descriptive statistics?
-Common charts for representing descriptive statistics include bar charts, pie charts, histograms, box plots, and violin plots. Each type offers different insights into the data.
Outlines

هذا القسم متوفر فقط للمشتركين. يرجى الترقية للوصول إلى هذه الميزة.
قم بالترقية الآنMindmap

هذا القسم متوفر فقط للمشتركين. يرجى الترقية للوصول إلى هذه الميزة.
قم بالترقية الآنKeywords

هذا القسم متوفر فقط للمشتركين. يرجى الترقية للوصول إلى هذه الميزة.
قم بالترقية الآنHighlights

هذا القسم متوفر فقط للمشتركين. يرجى الترقية للوصول إلى هذه الميزة.
قم بالترقية الآنTranscripts

هذا القسم متوفر فقط للمشتركين. يرجى الترقية للوصول إلى هذه الميزة.
قم بالترقية الآنتصفح المزيد من مقاطع الفيديو ذات الصلة


5.0 / 5 (0 votes)
