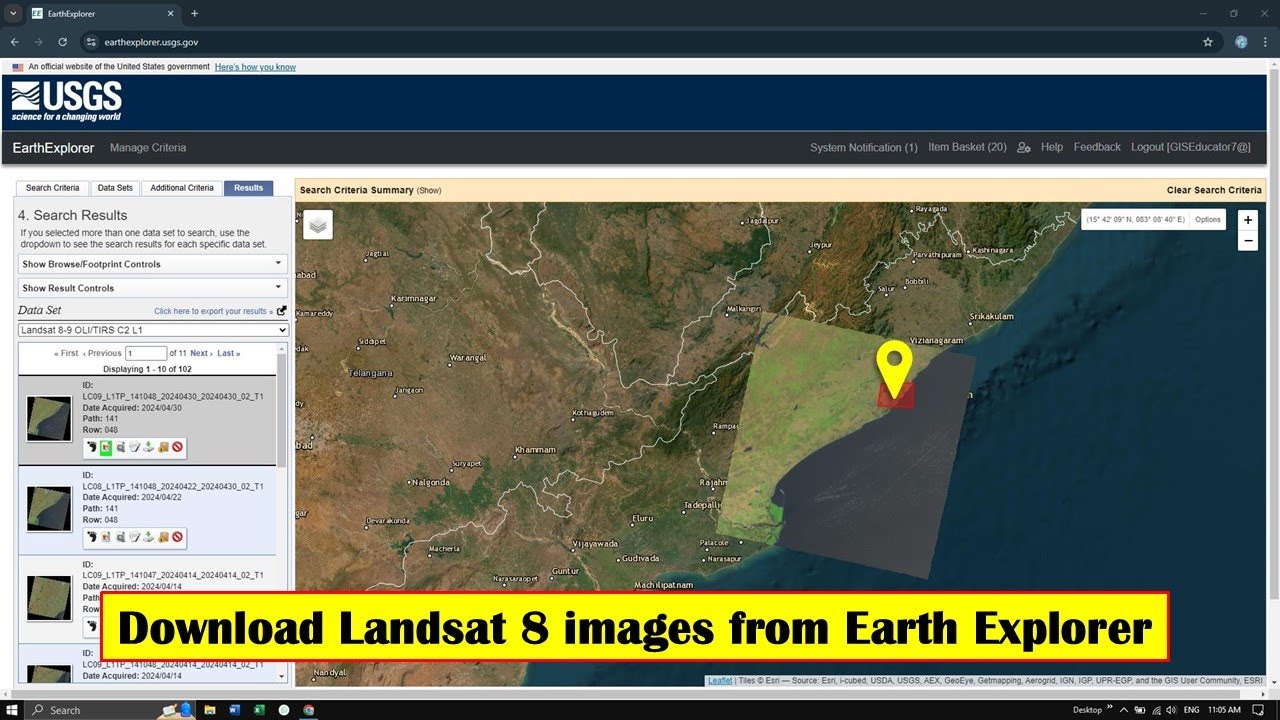
Download Landsat 8 images from EarthExplorer / USGS
Summary
TLDRThis tutorial explains how to download Landsat 8 imagery from Earth Explorer. The video guides users through the process, from logging into the Earth Explorer website to selecting the area of interest, setting the date range, and filtering cloud cover. It covers choosing between Landsat image collections and downloading individual bands or the entire dataset. The tutorial also provides tips for avoiding download interruptions and demonstrates how to view the downloaded bands in QGIS software. The step-by-step guide ensures that users can effectively access and manage satellite imagery.
Takeaways
- 🌐 Navigate to Earth Explorer by searching for it in a browser, then select the first result with the official link.
- 🔑 You need to log into Earth Explorer to download satellite imagery. Creating an account is easy if you don’t have one.
- 🗺️ You can select your area of interest either by clicking directly on the map, drawing a rectangle, or typing the region's name.
- 📅 Choose a date range for the imagery; in the example, it's from January 2021 to April 2022. You can also filter by specific months.
- ☁️ Adjust the cloud cover settings to exclude images with too much cloud, for example, reducing it to 0-20%.
- 📊 You can choose how many results to display per page, with options from 10 up to 250.
- 🛰️ Landsat products are categorized by collections, like Landsat Collection 2 Level 1 and 2. Select based on your needs, such as surface temperature or atmospheric reflectance.
- 🔍 Use additional criteria like satellite type and cloud cover percentage to refine your search for images.
- 📸 Preview, view metadata, and footprint of the images before downloading to ensure the selection matches your requirements.
- 💾 You can download individual bands or the entire image set. Downloading individual bands can be faster and more efficient if there are internet issues.
Q & A
What is the first step in downloading Landsat 8 imagery from Earth Explorer?
-The first step is to open your browser and search for 'Earth Explorer' in the search engine. Click on the first result, which is the official Earth Explorer website.
Do you need an account to download satellite products from Earth Explorer?
-Yes, you need to log into Earth Explorer to download satellite products. If you don't have an account, you can easily create one on the Earth Explorer website.
What are the different methods available to select your area of interest on Earth Explorer?
-You can select your area of interest by directly clicking on the map, drawing a rectangle or polygon over the area, or typing in the region name in the search bar.
How can you customize the date range for the imagery you want to download?
-You can specify the date range by selecting the start and end dates in the 'Date Range' section. You can also customize the search by choosing specific months if you don't need images from the entire year.
Why is it important to adjust the cloud cover percentage when searching for Landsat 8 imagery?
-Adjusting the cloud cover percentage is important because imagery with high cloud cover may not be suitable for analysis. You can set the cloud cover range to filter out images with too much cloud coverage.
What are the differences between Landsat Collection 2 Level 1 and Level 2 products?
-Landsat Collection 2 Level 1 includes panchromatic images and allows for top-of-atmospheric reflectance calculations, while Level 2 includes surface temperature and surface reflectance data but does not include the panchromatic band.
How can you filter the search results to show only Landsat 8 imagery?
-In the 'Additional Criteria' section, you can filter the results by selecting 'Landsat 8' under the 'Satellite' option.
What are the two methods available for downloading the Landsat 8 imagery and what are their advantages?
-You can download the entire band set at once or download each band individually. Downloading individually is beneficial because if the download is interrupted, you only need to re-download the affected band rather than the entire dataset.
Why is it important to download the metadata file along with the Landsat 8 imagery?
-The metadata file contains important information about the imagery, such as acquisition date, sensor details, and location. This data is essential for proper analysis of the images.
How can you view and stack the downloaded bands in QGIS?
-After downloading the bands, you can add them to a new project in QGIS. You can then stack the bands by selecting the desired combination, such as bands 5, 4, and 3, to view the composite image.
Outlines

هذا القسم متوفر فقط للمشتركين. يرجى الترقية للوصول إلى هذه الميزة.
قم بالترقية الآنMindmap

هذا القسم متوفر فقط للمشتركين. يرجى الترقية للوصول إلى هذه الميزة.
قم بالترقية الآنKeywords

هذا القسم متوفر فقط للمشتركين. يرجى الترقية للوصول إلى هذه الميزة.
قم بالترقية الآنHighlights

هذا القسم متوفر فقط للمشتركين. يرجى الترقية للوصول إلى هذه الميزة.
قم بالترقية الآنTranscripts

هذا القسم متوفر فقط للمشتركين. يرجى الترقية للوصول إلى هذه الميزة.
قم بالترقية الآنتصفح المزيد من مقاطع الفيديو ذات الصلة
How to Download Landsat 8 image from Earth Explorer | Free
QGIS Remote Sensing - Calculate NDVI
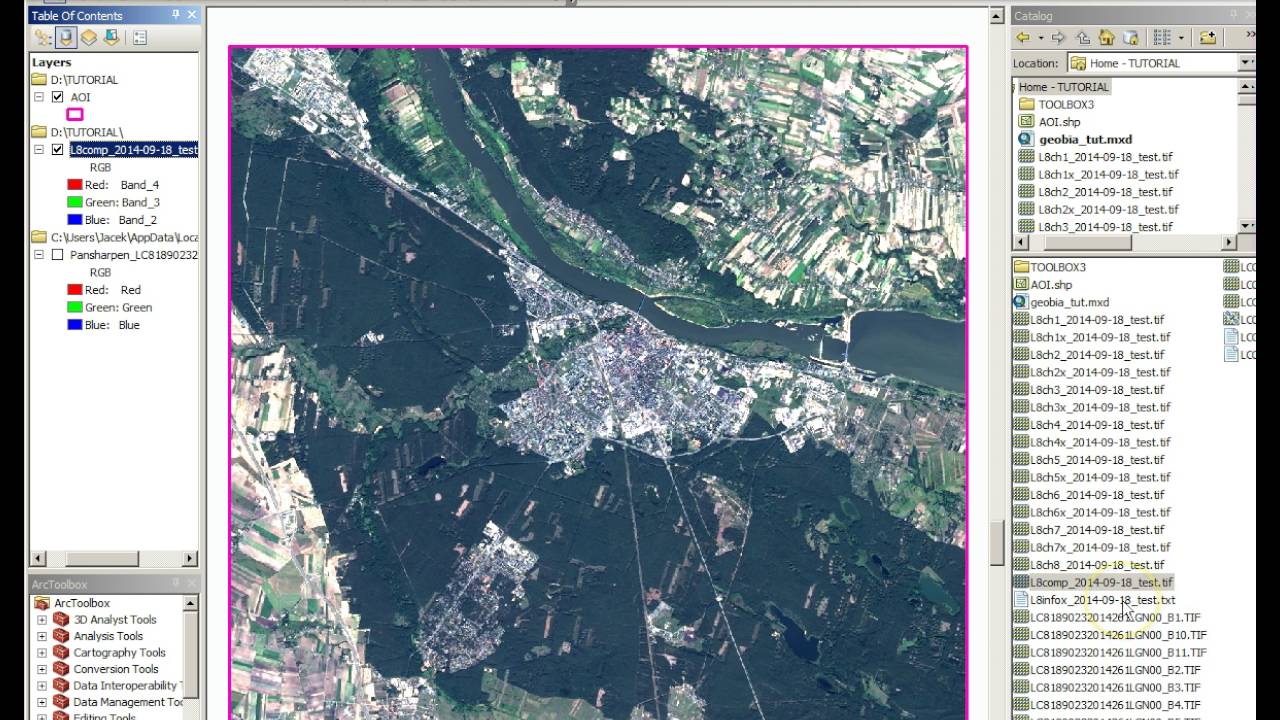
Tutorial Geobia for ArcGIS
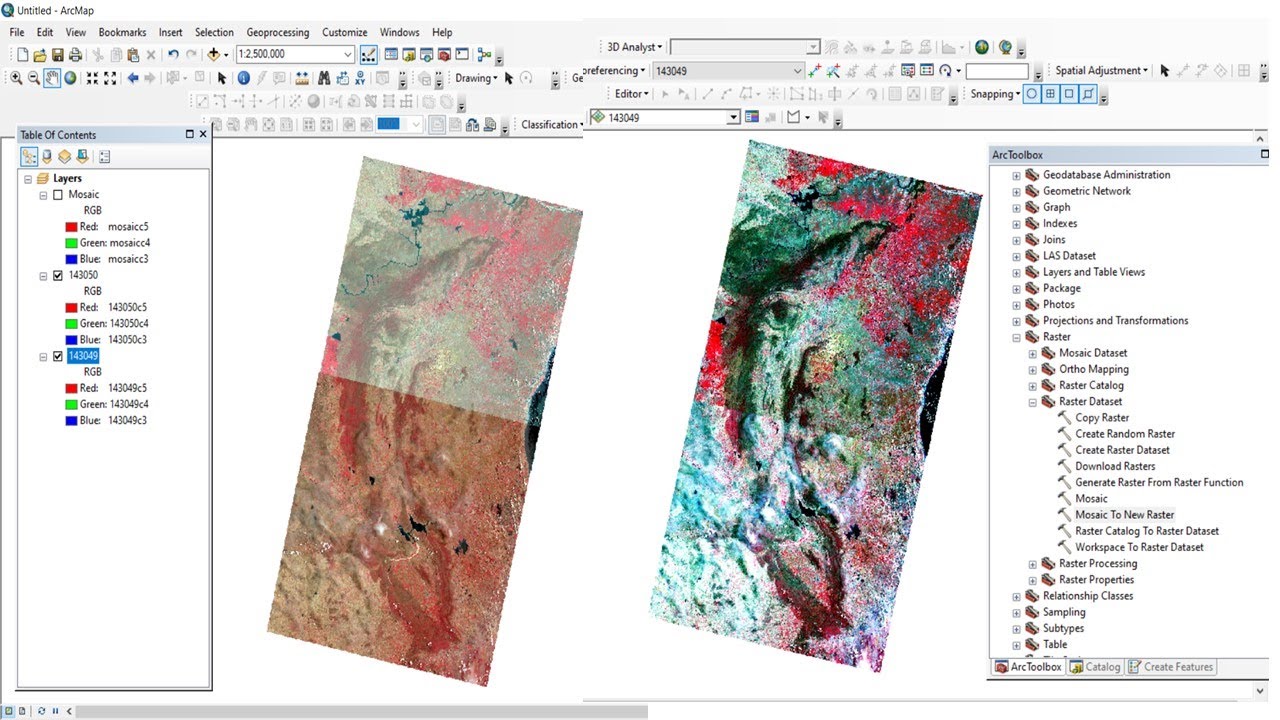
Band Composite & Mosaic of Landsat 8 data in ArcGIS
Tutorial Image Classification (Supervised) Menggunakan ArcGIS

GEE | Google Earth Engine Pengenalan Dasar, Tool dan Memanggil Citra
5.0 / 5 (0 votes)
