Candle Range Theory Explained and Simplified | Easily Predict the Next Candle

Smart Risk
7 Sept 202415:04

Summary

TLDRIn this episode of Smart Risk, the focus is on Candle Range Theory (CRT), an advanced trading concept that promises to enhance win rates by predicting price movements and formations. The video delves into the psychology behind CRT, explaining how every candlestick on a chart represents a price range. It outlines the market's three main phases: accumulation, manipulation, and distribution, known as the 'power of three.' The tutorial walks viewers through identifying CRT patterns using candlestick formations and offers practical tips for executing trades based on CRT, emphasizing the importance of timing and aligning time frames for high-probability trades.

Takeaways

  • 🔍 Candle Range Theory (CRT) is an advanced trading concept that can significantly improve win rates by predicting price movements and candle formations.
  • 📈 CRT is based on the idea that each candle on a chart represents a price range, which can be analyzed on lower time frames for more detailed insights.
  • 🌐 The market moves through three phases: accumulation, manipulation, and distribution, known as the 'power of three', which is a continuous cycle.
  • 🕒 The Asian, London, and New York trading sessions play crucial roles in identifying the accumulation, manipulation, and distribution phases, respectively.
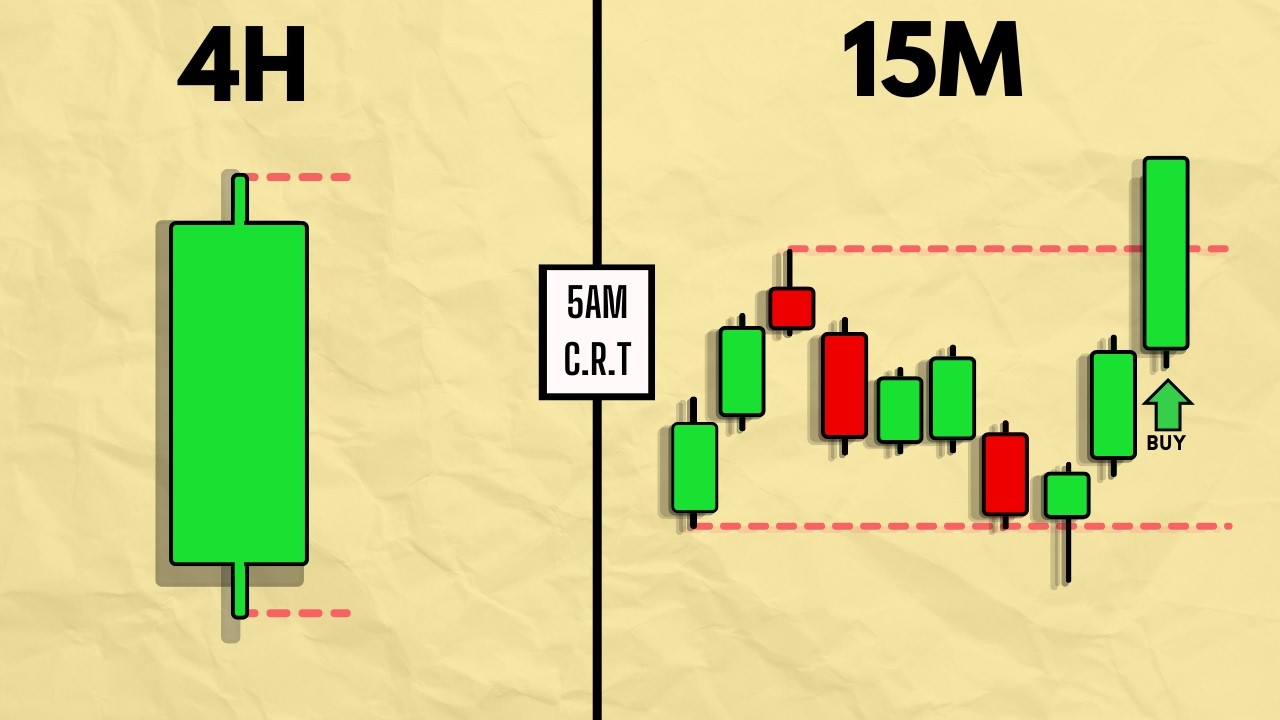
  • 📊 The 15-minute chart is recommended for recognizing CRT patterns as it provides clear price action aligned with higher time frames.
  • 📌 CRT patterns can be identified using Candlestick patterns, which can be a sequence of three or more candles, with the key being the range they form.
  • 🐉 In a bullish scenario, the CRT pattern involves a range candle setting up a range, a second candle sweeping through liquidity, and a third candle breaking out of the range.
  • 📉 Bearish markets also follow CRT principles, applying the same concepts to downward price movements and formations.
  • ⏰ Timing is essential for high-probability CRTs, with specific times in the Forex market being optimal for identifying and executing trades based on CRT patterns.
  • 📈 CRT provides a systematic approach to trading by simplifying the process with fixed objectives, rules, and minimal conditions to look for before executing a trade.

Q & A

  • What is Candle Range Theory (CRT)?

    -Candle Range Theory is an advanced trading concept that involves analyzing candlestick patterns to predict price movements and formations. It suggests that every candle on a chart represents a range of price action, which can be further analyzed on lower time frames.

  • How does CRT relate to the psychology of trading?

    -CRT is based on the idea that market movements can be understood through three main phases: accumulation, manipulation, and distribution. These phases reflect the market's heartbeat and are psychological stages that traders can use to anticipate price movements.

  • What are the three main phases of market movement according to CRT?

    -The three main phases are accumulation, manipulation, and distribution. Accumulation is a period of consolidation where price moves sideways. Manipulation involves taking out liquidity, and distribution occurs within the range created by manipulation.

  • Why is the Asian session important in CRT?

    -The Asian session is crucial in CRT because it often sets the stage for the day's trading by accumulating price action. The behavior of the Asian session can dictate whether the subsequent London and New York sessions will manipulate or accumulate further.

  • What is the 'power of three' in CRT?

    -The 'power of three' refers to the three-candle sequence that captures the accumulation, manipulation, and distribution phases within a single pattern. This sequence is considered a high-probability setup for successful trades.

  • How can traders identify CRT patterns using candlestick patterns?

    -Traders can identify CRT patterns by looking for specific sequences of candles on higher time frames, such as a range candle followed by a liquidity-taking candle and then a breakout candle. The key is to recognize the formation and the subsequent price action that confirms the pattern.

  • What is the recommended time frame for recognizing CRT patterns?

    -The 15-minute chart is recommended for recognizing CRT patterns as it provides clear price action that aligns with higher time frames and allows traders to identify key levels and potential breakouts.

  • What criteria and rules should be considered when identifying high-probability CRTs?

    -When identifying high-probability CRTs, traders should look for patterns around key levels, consider the timing of the pattern in relation to the market sessions, and match the entry time frame with the CRT's time frame. They should also consider the sequence of candles and the price action that confirms the pattern.

  • How can traders use the CRT model to execute trades?

    -Traders can use the CRT model to execute trades by identifying key times and patterns, zooming into appropriate time frames to monitor price action, and placing orders at strategic points such as order blocks or previous high/low points. They can set take profit levels based on the range of the CRT pattern.

  • What are the key times to consider for high-probability CRTs in the Forex market?

    -The key times for high-probability CRTs in the Forex market are 1:00 a.m., 5:00 a.m., 9:00 a.m., 1 p.m., 3:00 p.m., 6:00 p.m., and 9:00 p.m. These times correspond to market sessions and shifts in liquidity that can influence CRT patterns.

Outlines

00:00

📈 Introduction to Candle Range Theory

This paragraph introduces the video, which focuses on Candle Range Theory (CRT), an advanced concept in trading. The host explains that mastering CRT can help traders align with institutional money and predict price movements before they happen. The video promises a detailed walkthrough of CRT and encourages viewers to like, subscribe, and stay attentive throughout the session.

05:02

🔍 Understanding Candle Range Theory and Market Phases

Candle Range Theory is explained as the idea that every candle on a higher time frame represents a range, which can be broken down when zooming into a lower time frame. The market moves through phases of accumulation, manipulation, and distribution, a repeating cycle known as the 'Power of Three.' The paragraph highlights the importance of observing the Asian session for clues on the price movement for the London and New York sessions and recommends using a 15-minute chart for recognizing CRT patterns.

10:02

📊 Identifying CRT Patterns Using Candlestick Sequences

This section explains how to identify CRT patterns through a sequence of candles on higher time frames. In a bullish scenario, the sequence involves three candles: one to set the range, one to sweep liquidity, and one to break out of the range. The process can involve more than three candles, but the key is to recognize the manipulation and distribution phases. This applies to both bullish and bearish markets, and multiple examples are provided to show how ranges and liquidity sweeps form on the charts.

🚀 High-Probability CRT Models and Their Criteria

The paragraph focuses on high-probability CRT models, particularly those that effectively capture the accumulation, manipulation, and distribution phases within three candles. The process is described through a sell-side liquidity pool, accumulation of price, manipulation by taking out the range high, and distribution towards the sell-side liquidity. The section also lists key times to identify CRT patterns and explains how to match higher and lower time frames for executing trades.

💡 Applying CRT to Real Market Scenarios

This section walks through real-time application of CRT on NASDAQ and the Euro-Dollar charts. By identifying key candles at crucial times, such as the 2 PM candle, the process involves zooming into lower time frames to find entry points after confirming a CRT pattern. The price action, liquidity sweeps, and eventual take-profit targets are outlined, demonstrating how traders can apply CRT in different time frames for optimal trade execution.

🏆 Conclusion and Trade Success Example

The final part summarizes a successful trade example using the CRT model. The host walks through how the trade played out on the Euro-Dollar pair, confirming a CRT model, finding entry points, and achieving take-profit targets. The video concludes with a call to action for viewers to subscribe and leave feedback, with promises of future content focused on trading strategies.

Mindmap

Keywords

💡Candle Range Theory (CRT)

Candle Range Theory (CRT) is an advanced trading concept discussed in the video, which is claimed to be a secret from the ICT trading community. It is presented as a model that can potentially increase a trader's win rates by predicting price movements and candle formations before they occur. The video suggests that mastering CRT will allow traders to align with institutional money, rather than being on the opposite side of their trades. CRT is used throughout the script to demonstrate how to analyze and predict market movements based on candlestick patterns.

💡Accumulation

Accumulation is one of the three main phases of market movement described in the video, alongside manipulation and distribution. It refers to a period of consolidation where the price moves sideways, typically occurring at the beginning of a cycle. The video uses the concept of accumulation to explain the first phase of the 'power of three' pattern, which is a recurring market behavior. For example, the script mentions that if the Asian session has accumulated, it sets the stage for the London session to manipulate and the New York session to distribute.

💡Manipulation

Manipulation is the second phase in the market movement cycle described by the video, following accumulation and preceding distribution. It involves taking out liquidity and is characterized by price action that moves the market away from a consolidation phase. The video script uses manipulation to illustrate how the market can change direction, often leading to a breakout from a range, which is a key element in identifying CRT patterns.

💡Distribution

Distribution is the final phase in the market movement cycle outlined in the video, following accumulation and manipulation. It is where the market is said to distribute within the range created by the manipulation phase. The concept of distribution is used to explain the final stage of the 'power of three' pattern, where the price is expected to continue in a particular direction, often leading to a profitable trading opportunity.

💡Asian, London, and New York Sessions

These terms refer to the different trading sessions that occur in the global forex market, each associated with a specific geographical region. The video script uses these sessions to explain the typical flow of market activity throughout the day. For instance, the script suggests that if the Asian session accumulates, the London session is expected to manipulate, and the New York session to distribute, which is a key aspect of identifying the 'power of three' phases in CRT.

💡15-Minute Chart

The 15-minute chart is highlighted in the video as the best time frame for recognizing CRT patterns. It provides clear price action that aligns with higher time frames, making it a preferred tool for traders to identify and act on CRT signals. The video script uses the 15-minute chart as an example of how to apply CRT in practice, suggesting that it offers a balance between detail and a broader market view.

💡Candlestick Patterns

Candlestick patterns are visual representations of price movements used in technical analysis. The video script discusses how these patterns can be used to identify CRT patterns, such as a sequence of candles that indicate a range, a breakout, or a sweep. The video provides examples of bullish and bearish scenarios, explaining how certain candlestick formations can signal high probability trading opportunities within the CRT framework.

💡Key Levels

Key levels are significant price points that act as support or resistance in the market. The video script emphasizes the importance of identifying CRT patterns around these key levels, as they are more likely to lead to successful trades. The concept of key levels is integral to the CRT model, as it helps traders pinpoint areas where the market is more likely to react, providing potential entry and exit points for trades.

💡Timing

Timing is crucial in the CRT model, as it dictates when to identify and act on CRT patterns for high probability trades. The video script lists specific times in the forex market that are considered optimal for identifying CRTs, such as 1:00 a.m., 5:00 a.m., and other key times. Proper timing is essential for aligning with the market's natural rhythm and increasing the chances of a successful trade.

💡Entry and Exit Points

Entry and exit points are the specific price levels at which a trader decides to enter or exit a trade. The video script provides guidance on how to use CRT to identify these points, such as waiting for a candle to sweep below a range and then push back inside to confirm a pattern before entering a trade. Understanding entry and exit points is fundamental to executing trades based on the CRT model effectively.

💡Stop Loss and Take Profit

Stop loss and take profit are risk management tools used in trading to limit potential losses and lock in profits. The video script discusses setting stop losses below key support levels and take profits at the midpoint or high of a range, depending on the risk-reward ratio sought. These tools are essential for managing risk and protecting profits in the context of the CRT model.

Highlights

Introduction to Candle Range Theory, an advanced trading concept that can significantly improve win rates by predicting price movements and formations.

Candle Range Theory is based on the idea that each candle on a chart represents a range of price action, which can be analyzed on different time frames.

Market movement is described through three main phases: accumulation, manipulation, and distribution, forming a continuous cycle.

The 'power of three' concept explains how price cycles through accumulation, manipulation, and distribution within a three-candle sequence.

The Asian, London, and New York trading sessions are key to identifying the accumulation, manipulation, and distribution phases.

The 15-minute chart is recommended for recognizing CRT patterns due to its clear price action alignment with higher time frames.

Bullish and bearish scenarios can be identified using Candlestick patterns to predict market movements.

CRT patterns can form with more than three candles, but the key is the sequence's relation to the range and liquidity.

Examples of high-probability CRT models are provided, showing how they capture the essential market phases within a three-candle sequence.

Criteria and rules for identifying high-probability CRTs include looking for patterns around key levels and timing entries at specific times.

The importance of matching entry time frames with CRT's time frame is emphasized for effective trading.

A step-by-step guide on how to use the CRT model to execute trades, including identifying key times and levels.

Practical examples demonstrate how to apply the CRT model to the NASDAQ and Euro Dollar charts for trading decisions.

Strategies for setting entry points and take profit levels based on CRT patterns for optimal risk-reward ratios.

The video concludes with a call to action for viewers to subscribe and engage with the content for further educational value.

Transcripts

play00:00

hey Traders and welcome to another

play00:01

episode of smart risk today we will talk

play00:05

about the candle range Theory an

play00:07

advanced concept that's been kept secret

play00:09

from the ICT trading Community but has

play00:11

the potential to Skyrocket your win

play00:13

rates by mastering this concept you will

play00:15

be able to predict upcoming price

play00:17

movements and candle formations before

play00:19

they even happen in the market this

play00:21

powerful trading model will give you

play00:23

insights into being on the same side as

play00:25

institutional money instead of being on

play00:27

the opposite side of their trades so

play00:30

make sure not to miss any part of this

play00:31

video and watch

play00:33

carefully we're going Beyond just Theory

play00:35

today we'll walk you through the candle

play00:37

range Theory step by step breaking down

play00:40

the key points and Concepts you need to

play00:41

fully Master this Advanced trading model

play00:44

we always appreciate your support so

play00:46

please give this video a thumbs up and

play00:48

subscribe to our Channel if you are new

play00:50

see you after intro

play00:52

[Music]

play00:59

[Music]

play01:01

welcome back Traders so let's get

play01:04

started before we jump into the basics

play01:07

of Candlestick CRTs let's take a moment

play01:09

to understand the psychology behind

play01:11

candle range Theory so what exactly is

play01:15

candle range Theory the idea is simple

play01:18

every candle you see on a chart

play01:19

represents a range in other words a

play01:22

candle you see on a higher time frame is

play01:24

just a range of price action when you

play01:26

zoom in to a lower time frame since

play01:29

ranges can be swept WT broken out or

play01:31

retested in the market all of these

play01:33

actions can also show up in Candlestick

play01:36

patterns every candle has a high and a

play01:38

low right so if you zoom in you'll see

play01:41

that a range forms between the candle's

play01:43

highest and lowest points on a lower

play01:45

time frame you've probably noticed that

play01:47

the market moves through three main

play01:49

phases accumulation manipulation and

play01:53

distribution price is always cycling

play01:55

through these phases imagine it like a

play01:57

never-ending Loop for first the price

play02:01

accumulates then it gets manipulated and

play02:03

finally it's distributed before the

play02:05

whole process starts over again this

play02:07

pattern is what we call the power of

play02:09

three and it's basically the heartbeat

play02:11

of the

play02:14

market basically the price goes through

play02:16

an accumulation phase which is

play02:18

essentially a period of consolidation

play02:20

where the price moves

play02:21

sideways then it manipulates by taking

play02:24

out liquidity and finally it distributes

play02:27

within the range that the manipulation

play02:28

created this is where you should start

play02:30

looking for the typical AMD the Asian

play02:33

session the London session and the New

play02:35

York session if the Asian session has

play02:38

accumulated you typically expect the

play02:39

London session to manipulate and then

play02:41

the New York session to

play02:43

distribute but here's a pro tip to keep

play02:45

in mind if the price has expanded

play02:48

instead of accumulating during the Asian

play02:50

session don't expect the London session

play02:52

to

play02:53

manipulate instead you should expect it

play02:55

to accumulate which means you then look

play02:57

for the New York session to manipulate

play03:01

so it all comes down to what the Asian

play03:03

session did just check out the Asian

play03:05

session first and that will give you the

play03:07

most accurate way to identify AMD and

play03:10

the power of the three

play03:12

phases regarding time frames the

play03:14

15-minute chart is your best bet for

play03:16

recognizing AMD it gives you clear price

play03:19

action that also aligns with higher time

play03:22

frames so with that in mind let's dive

play03:25

into how you can identify a CRT pattern

play03:27

using Candlestick patterns afterward

play03:30

we'll look at different scenarios that

play03:32

might come up when you're trying to

play03:33

identify CRTs on your

play03:37

chart in the bullish scenario the

play03:39

Candlestick based CRT typically refers

play03:42

to a three candle sequence on a higher

play03:44

time frame like 1 hour or upper here's

play03:47

how it works the first candle sets up a

play03:50

range with its high and low the second

play03:53

candle takes out the liquidity of the

play03:55

first candle by a wick the third candle

play03:58

breaks out of this range

play04:00

keep in mind though that the CRT model

play04:02

doesn't always have to be a three candle

play04:04

sequence it can also form with a series

play04:07

of more than three candles the key

play04:10

difference is that a three candle

play04:11

sequence typically happens over a

play04:13

shorter period but the principle Remains

play04:15

the Same whether it's three candles or

play04:17

more for example in this candle series

play04:20

you can see that multiple candles were

play04:22

formed to reach the highest point of the

play04:23

range candle the sequence goes like this

play04:26

first a range candle was formed followed

play04:29

by an inside bar then we had a sweeping

play04:32

candle that swept below the range with

play04:34

its shadow and finally the price formed

play04:37

several more candles until it hit the

play04:38

high of the range

play04:40

candle these Concepts also apply to

play04:43

bearish markets you can apply these

play04:45

principles across different time frames

play04:47

and on any price action based

play04:50

chart to solidify what we have learned

play04:52

so far let's see more examples of

play04:54

Candlestick based CRT models that we

play04:57

might encounter in the market

play04:59

starting from the top this first

play05:01

scenario is the most critical CRT model

play05:04

offering a high probability of

play05:06

success why because it perfectly

play05:09

captures the accumulation manipulation

play05:12

and distribution phases all within a

play05:14

three candle sequence what we call the

play05:17

power of three in just three

play05:19

candles let's say we have a perfect

play05:21

cell-side liquidity pool right beneath

play05:24

this bullish

play05:25

candle what happens next is that the

play05:27

price pushes upward entering the

play05:29

accumulation phase the price then

play05:32

manipulates by taking out the high of

play05:34

the range and finally it enters the

play05:37

distribution phase signaling that the

play05:39

price will likely continue downwards

play05:41

toward the sells side

play05:42

liquidity this gives us a clear

play05:44

continuation to the

play05:47

downside here we've already seen the

play05:49

accumulation manipulation and

play05:52

distribution the complete power of

play05:56

three next we see a range candle

play05:59

followed by a bullish green candle that

play06:01

sweeps below the range then the price

play06:04

forms multiple candles until it closes

play06:07

above the

play06:09

range once again a range is formed

play06:13

liquidity gets taken out and then the

play06:15

price pushes higher eventually reaching

play06:17

the range as

play06:19

high it's the same scenario here a range

play06:22

candle forms but it takes a bit longer

play06:24

for the price to sweep the range candle

play06:27

low then almost immediately the price

play06:30

reverses Direction heads towards the

play06:32

range as high and closes above

play06:35

it the rest follow the same pattern as

play06:38

the examples we've just

play06:40

discussed now let's see what criteria

play06:42

and rules we need to consider in order

play06:44

to identify high probability

play06:48

CRTs CRT is basically an objective and

play06:51

mechanical way to simplify your trading

play06:53

by suggesting simple steps fixed

play06:55

objectives and rules and also by

play06:58

minimizing the terms and condition that

play06:59

you need to look for to execute a high

play07:01

probability

play07:05

trade first you need to look for CRTs

play07:08

around key levels so the higher time

play07:10

frame candle should be identified around

play07:12

the key

play07:13

areas second timing is crucial make sure

play07:17

you're identifying CRTs at Key times for

play07:21

high probability CRTs here are the key

play07:23

times to consider in the Forex Market

play07:26

1:00 a.m. 5:00 a.m. 9:00 a.m. 1 p.m. 300

play07:30

p.m. 6 and 900

play07:33

p.m. for matching your entry time frame

play07:35

with the crt's time frame you should

play07:38

consider that if your identified CRT

play07:40

range is on the monthly time frame then

play07:43

for entry you should use the daily time

play07:45

frame if your CRT comes from the daily

play07:48

chart you should execute your trade in

play07:50

the 1hour time frame if your identified

play07:53

CRT is on the 4-Hour time frame then

play07:56

entries must come from the 15-minute

play07:57

time frame if your CRT is on the 1 hour

play08:01

time frame then you can use a 5 minute

play08:03

or 1 minute time frame for your entry if

play08:06

you use the 15-minute time frame to

play08:08

identify CRTs then you should use one

play08:10

minute to place a sell or buy

play08:12

position now let's see how to use the

play08:15

CRT model to our advantage and execute

play08:17

trades based on

play08:19

it here we have the NASDAQ 1hour time

play08:23

frame on the

play08:26

screen as you can see the price has

play08:28

created a large bearish candle at 2:

play08:31

p.m. a key time so I'm going to

play08:34

highlight its high and low as the

play08:36

potential CRT range candle high and

play08:46

low next I'll zoom into the 15-minute

play08:50

time frame and wait for the 300 p.m

play08:52

candle to form

play09:03

now as you can see the 3pm candle has

play09:06

formed and I'll highlight its high and

play09:09

low as the latest candle range high and

play09:26

low if you look closely you can see that

play09:28

the three PM candle sweeps below the

play09:30

range of the hourly 2PM candle with its

play09:34

Wick and then immediately pushes back

play09:37

inside the 2PM candles

play09:40

range following this we see the price

play09:43

push upwards and eventually close above

play09:45

the 3pm candle

play09:48

high if we zoom out to the 1hour time

play09:51

frame we can see that the price has

play09:53

swept the 2PM candles low with this 3pm

play09:55

dogee candle confirming a CRT model

play09:58

formed at a key time there's a high

play10:00

probability that after completing the

play10:02

manipulation phase by sweeping sell-side

play10:04

liquidity below the 2PM candles range

play10:07

the price will push higher toward the

play10:09

buy side liquidity above the 1H hour 2PM

play10:11

candle this provides a great opportunity

play10:14

to go long in the

play10:15

market next I'll zoom into the 5minute

play10:18

time frame to find an entry opportunity

play10:20

for a long position

play10:37

as you can see there's an order block on

play10:39

the 5 minute time

play10:46

frame which is the last selling candle

play10:48

before the price started a bullish move

play10:50

that broke out above the 15-minute

play10:52

candle's high and closed above

play10:56

it I'm going to place my buy limit order

play10:59

at the the highest point of this order

play11:00

block and wait for the price to activate

play11:06

it for the takeprofit you can either set

play11:09

it at the midpoint of the 1H hour time

play11:11

frames range which provides a 2:1 reward

play11:14

to risk ratio or at the highest point of

play11:16

the

play11:22

range which gives an R to ratio of

play11:26

4.9 now let's see what happens next

play11:34

as you can see the price has activated

play11:36

our by limit order and we are officially

play11:38

in the

play11:54

market the first takeprofit is hit as

play11:57

the price reaches the midpoint of the

play12:16

range eventually the price hits the

play12:19

second profit Target at the highest

play12:20

point of the 1hour time frame's 2PM

play12:22

candle range and the trade plays out

play12:25

successfully now let's move on to the

play12:27

next example

play12:30

here we have the euro dollar 1hour time

play12:32

frame on the screen as you can see we

play12:35

have a perfect CRT model based on this

play12:37

1H hour 9 a.m. candle we have all three

play12:40

steps of the power of three accumulation

play12:43

manipulation and

play12:45

distribution after forming this large

play12:47

candle as crt's range candle we can see

play12:50

that the price swept the liquidity

play12:52

accumulated below the first candle with

play12:54

a wick then closed inside the range and

play12:57

after price immediately pushed to the

play12:59

high of the candle

play13:00

range let's see if we were behind the

play13:03

screen and monitoring the market how

play13:06

could we enter the market with this CRT

play13:08

model after identifying our range candle

play13:11

and drawing the high and the low of the

play13:12

range candle as the CR and crl we need

play13:16

to zoom into the 15minute time frame to

play13:18

gain a clearer view of price action and

play13:20

also to monitor the Candlestick

play13:23

better in the next step we should wait

play13:26

for the 9:00 a.m. and monitor the price

play13:28

action in this spefic specific time as

play13:31

you can see price pushed lower and has

play13:32

taken below of the range candle with 900

play13:34

a.m. candle and after sweeping the

play13:37

liquidity and after conducting the

play13:38

manipulation phase pushed upside and

play13:40

closed inside the range with this

play13:42

bullish candle so we have a confirmed

play13:46

CRT model formed during a key time hence

play13:50

we know that the price is going to move

play13:52

higher and touch the highest point of

play13:53

the range candle so we are looking for

play13:56

an opportunity to go long that we need

play13:58

to zoom into to the 5 minute time frame

play14:00

or 1 minute time frame to place an entry

play14:03

to do that I am going to zoom into the

play14:05

5-minute time frame and place my entry

play14:08

at the highest point of this order block

play14:11

and also put my stoploss couple pip

play14:13

below the area and for setting the

play14:15

takeprofit we have two

play14:17

options we can aim for the equilibrium

play14:20

or midpoint of the range candle or if

play14:23

you seek for a more risky trade with a

play14:25

higher reward to risk ratio you can aim

play14:27

for the high of the candle

play14:29

range as you can see after mitigating

play14:32

the 5-minute order block the price

play14:35

pushed higher and eventually touched the

play14:37

candle ranges High providing a perfect

play14:39

CRT model

play14:41

entry that's it Traders thank you for

play14:43

watching this video I hope you found it

play14:45

informative and useful don't forget to

play14:48

hit the Subscribe button and turn on

play14:49

notifications to stay updated on our

play14:51

latest videos we value your feedback and

play14:54

suggestions so please leave your

play14:56

comments below and let us know what

play14:57

topics you'd like us to cover in our

play14:59

future videos we appreciate your support

play15:01

and look forward to seeing you in the

play15:03

next episode

Rate This

5.0 / 5 (0 votes)

الوسوم ذات الصلة
Trading StrategiesCandlestick PatternsMarket AnalysisFinancial EducationPrice PredictionRisk ManagementTechnical AnalysisInstitutional TradingMarket PsychologyTrading Theory
هل تحتاج إلى تلخيص باللغة الإنجليزية؟