Statistika Matematika Kelas 12 • Part 1: Pengertian Statistika dan Jenis-Jenis Data
Summary
TLDRThis video from 'Jendela Sains' channel introduces the concept of statistics, focusing on the first type, descriptive statistics. It explains the meaning of data, distinguishing between qualitative and quantitative data, and further categorizes quantitative data into discrete and continuous types. The script outlines the steps of statistical analysis, from data collection to processing and presentation, emphasizing the importance of descriptive statistics in organizing and summarizing data for decision-making.
Takeaways
- 📚 The video discusses the first topic of statistics, which includes the meaning of statistics and types of data.
- 📈 Statistics is a science related to data, which is a collection of descriptions or information obtained from observations.
- 🔢 Data can be presented in various forms, such as tables and diagrams, including line charts, bar charts, and pie charts.
- 📊 Data is categorized as either singular (Tatum) or plural (Jamak), with the latter being a collection of information.
- 🔍 Data is divided into qualitative and quantitative types, with qualitative data lacking numerical values and being based on categories or attributes.
- 📐 Quantitative data includes numerical values, such as students' math test scores, which can be discrete or continuous.
- 📉 Discrete data is obtained by counting, such as the number of siblings, and does not include fractions.
- 📊 Continuous data is obtained by measuring, such as height or weight, and can include decimal points depending on the precision of the measuring tool.
- 🔑 The process of statistics involves data collection, grouping, presentation, processing, analysis, and decision-making based on the analysis.
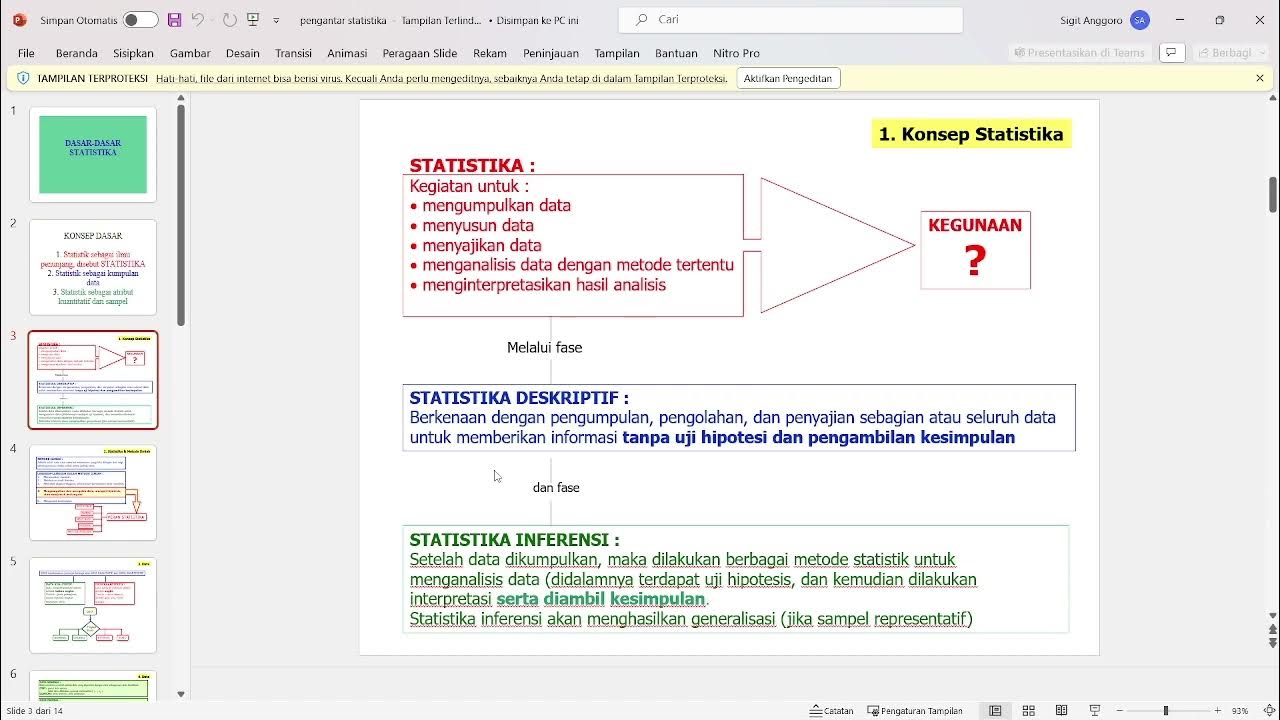
- 📝 Descriptive statistics involves the collection, grouping, and presentation of data, while inferential statistics includes data analysis, drawing conclusions, and making decisions.
- 📚 The video focuses on descriptive statistics and will cover inferential statistics in a later semester.
Q & A
What is the main topic of the video?
-The main topic of the video is an introduction to statistics, focusing on the concept of statistics and types of data.
What are the various ways to present data as mentioned in the video?
-The video mentions that data can be presented in various forms such as tables and diagrams, including line charts, bar charts, and pie charts.
What is the difference between data and a datum?
-Data is a plural term referring to a collection of descriptions or information obtained from an observation, while datum is the singular form, referring to a single piece of information.
What are the two main types of data discussed in the video?
-The two main types of data discussed are qualitative data, which consists of categories or attributes without numerical values, and quantitative data, which includes numerical values.
Can you provide an example of qualitative data mentioned in the video?
-Examples of qualitative data given in the video include 'berhasil' (successful) and 'gagal' (failed), 'baik' (good) and 'rusak' (broken), and 'lulus' (pass) or 'remidi' (fail).
How is quantitative data different from qualitative data?
-Quantitative data includes numerical values, such as scores on a math test, while qualitative data does not have numerical values and is based on categories or attributes.
What are the two subcategories of quantitative data mentioned in the video?
-The two subcategories of quantitative data are discrete data, which is obtained by counting or categorizing, and continuous data, which is obtained by measuring.
Can you give an example of discrete data from the video?
-An example of discrete data given in the video is the number of siblings, which is counted as whole numbers and cannot be fractional.
How is continuous data different from discrete data?
-Continuous data is obtained by measuring and can include fractions or decimals, such as height or weight, whereas discrete data is counted in whole numbers without fractions.
What are the stages of statistics mentioned in the video?
-The stages of statistics mentioned are data collection, data grouping, data presentation, data processing, data analysis, and decision-making.
What is the difference between descriptive and inferential statistics as discussed in the video?
-Descriptive statistics involve data collection, grouping, presentation, and processing, while inferential statistics involve data analysis, drawing conclusions, and decision-making.
Outlines

此内容仅限付费用户访问。 请升级后访问。
立即升级Mindmap

此内容仅限付费用户访问。 请升级后访问。
立即升级Keywords

此内容仅限付费用户访问。 请升级后访问。
立即升级Highlights

此内容仅限付费用户访问。 请升级后访问。
立即升级Transcripts

此内容仅限付费用户访问。 请升级后访问。
立即升级5.0 / 5 (0 votes)


