Statistika Matematika Kelas 12 • Part 1: Pengertian Statistika dan Jenis-Jenis Data

Jendela Sains
3 Nov 202106:52

Summary

TLDRThis video from 'Jendela Sains' channel introduces the concept of statistics, focusing on the first type, descriptive statistics. It explains the meaning of data, distinguishing between qualitative and quantitative data, and further categorizes quantitative data into discrete and continuous types. The script outlines the steps of statistical analysis, from data collection to processing and presentation, emphasizing the importance of descriptive statistics in organizing and summarizing data for decision-making.

Takeaways

  • 📚 The video discusses the first topic of statistics, which includes the meaning of statistics and types of data.
  • 📈 Statistics is a science related to data, which is a collection of descriptions or information obtained from observations.
  • 🔢 Data can be presented in various forms, such as tables and diagrams, including line charts, bar charts, and pie charts.
  • 📊 Data is categorized as either singular (Tatum) or plural (Jamak), with the latter being a collection of information.
  • 🔍 Data is divided into qualitative and quantitative types, with qualitative data lacking numerical values and being based on categories or attributes.
  • 📐 Quantitative data includes numerical values, such as students' math test scores, which can be discrete or continuous.
  • 📉 Discrete data is obtained by counting, such as the number of siblings, and does not include fractions.
  • 📊 Continuous data is obtained by measuring, such as height or weight, and can include decimal points depending on the precision of the measuring tool.
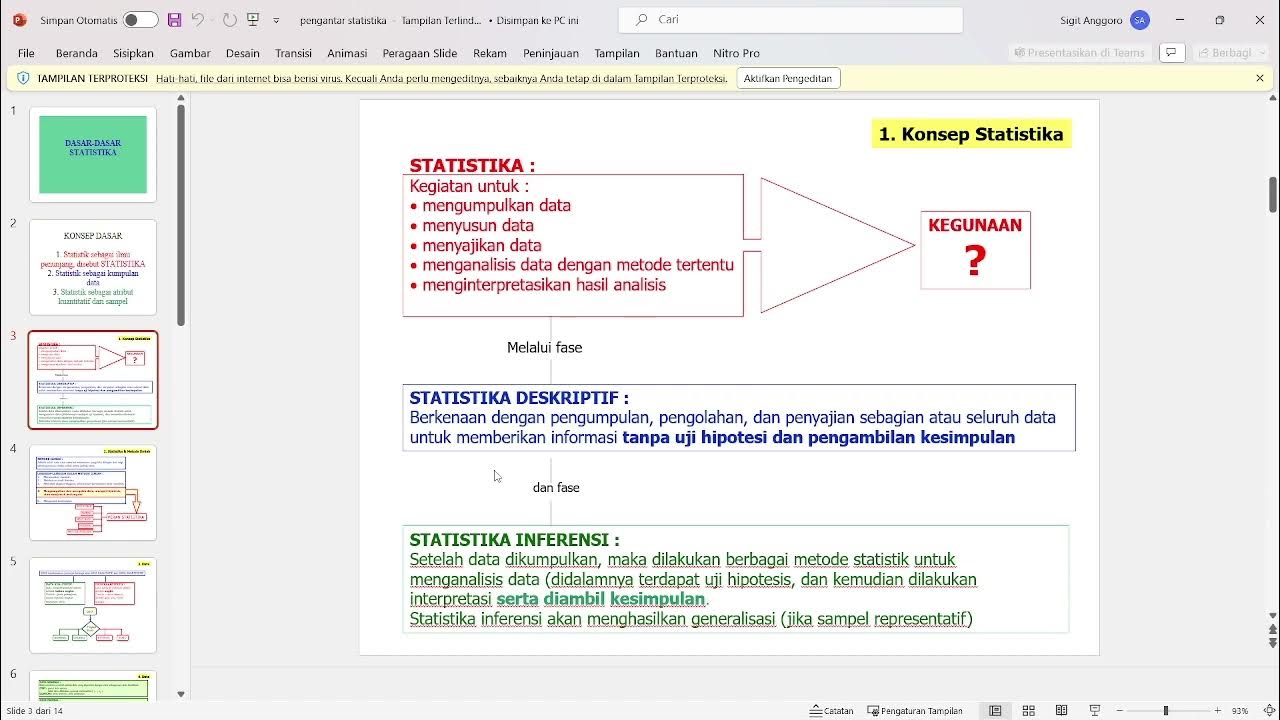
  • 🔑 The process of statistics involves data collection, grouping, presentation, processing, analysis, and decision-making based on the analysis.
  • 📝 Descriptive statistics involves the collection, grouping, and presentation of data, while inferential statistics includes data analysis, drawing conclusions, and making decisions.
  • 📚 The video focuses on descriptive statistics and will cover inferential statistics in a later semester.

Q & A

  • What is the main topic of the video?

    -The main topic of the video is an introduction to statistics, focusing on the concept of statistics and types of data.

  • What are the various ways to present data as mentioned in the video?

    -The video mentions that data can be presented in various forms such as tables and diagrams, including line charts, bar charts, and pie charts.

  • What is the difference between data and a datum?

    -Data is a plural term referring to a collection of descriptions or information obtained from an observation, while datum is the singular form, referring to a single piece of information.

  • What are the two main types of data discussed in the video?

    -The two main types of data discussed are qualitative data, which consists of categories or attributes without numerical values, and quantitative data, which includes numerical values.

  • Can you provide an example of qualitative data mentioned in the video?

    -Examples of qualitative data given in the video include 'berhasil' (successful) and 'gagal' (failed), 'baik' (good) and 'rusak' (broken), and 'lulus' (pass) or 'remidi' (fail).

  • How is quantitative data different from qualitative data?

    -Quantitative data includes numerical values, such as scores on a math test, while qualitative data does not have numerical values and is based on categories or attributes.

  • What are the two subcategories of quantitative data mentioned in the video?

    -The two subcategories of quantitative data are discrete data, which is obtained by counting or categorizing, and continuous data, which is obtained by measuring.

  • Can you give an example of discrete data from the video?

    -An example of discrete data given in the video is the number of siblings, which is counted as whole numbers and cannot be fractional.

  • How is continuous data different from discrete data?

    -Continuous data is obtained by measuring and can include fractions or decimals, such as height or weight, whereas discrete data is counted in whole numbers without fractions.

  • What are the stages of statistics mentioned in the video?

    -The stages of statistics mentioned are data collection, data grouping, data presentation, data processing, data analysis, and decision-making.

  • What is the difference between descriptive and inferential statistics as discussed in the video?

    -Descriptive statistics involve data collection, grouping, presentation, and processing, while inferential statistics involve data analysis, drawing conclusions, and decision-making.

Outlines

00:00

📊 Introduction to Statistics and Data Types

The video introduces the concept of statistics, focusing on the definition of statistics and the various types of data. It explains the difference between qualitative and quantitative data, highlighting that qualitative data is categorical or based on attributes, such as success or failure, while quantitative data includes numerical values like test scores. The video also distinguishes between discrete data, which is counted in whole numbers, and continuous data, which can be measured with potential decimal values. It uses examples like the height of students in a class to illustrate the concepts and emphasizes the importance of understanding data presentation through tables and diagrams.

05:01

📚 The Process of Statistical Analysis

This paragraph outlines the steps involved in statistical analysis, starting with data collection. After data is gathered, it is organized, presented in tables or diagrams, and then processed. The next step is data analysis to draw conclusions, which leads to decision-making. The video categorizes statistics into two groups: descriptive statistics, which includes data collection, organization, presentation, and processing, and inferential statistics, which involves data analysis, conclusion drawing, and decision-making. The speaker mentions that they will focus only on descriptive statistics in this video and will cover inferential statistics in a later semester. The video concludes by inviting viewers to check out the complete playlist for more topics and to leave comments with questions or feedback.

Mindmap

Keywords

💡Statistics

Statistics is the science of collecting, analyzing, interpreting, and presenting data. In the video, it is the central theme, where the presenter discusses the concept and types of data, which are integral to understanding statistics. The script mentions that statistics is related to data, which is a collection of descriptions or information obtained from an observation.

💡Data

Data refers to a collection of descriptions or information derived from an observation. In the context of the video, data is categorized into qualitative and quantitative, and further into discrete and continuous data. The script uses examples such as the height of students in a class, which is a set of data points, to illustrate the concept.

💡Qualitative Data

Qualitative data consists of non-numerical attributes or categories. It is used to describe qualities or characteristics of items or events. The video script mentions examples like 'success' or 'failure', 'good' or 'broken', which are qualitative as they do not involve numbers but rather describe attributes.

💡Quantitative Data

Quantitative data is numerical and can be measured or counted. It includes data such as test scores or heights, which can be expressed with numbers. The script uses the example of students' math scores to illustrate quantitative data, which can be analyzed statistically.

💡Discrete Data

Discrete data are data points that are separate and distinct, often counted in whole numbers. The video script explains that discrete data, such as the number of siblings, cannot be fractional, hence they are distinct counts like 1, 2, 3, etc.

💡Continuous Data

Continuous data can take on any value within a range and can include fractions or decimals. The script mentions height and weight measurements as examples of continuous data, which can be measured with a high degree of precision, potentially resulting in values like 161.57 cm or 59.5 kg.

💡Descriptive Statistics

Descriptive statistics involves organizing and summarizing data to describe its main features. The video script outlines the steps of statistics, starting with data collection and grouping, followed by presentation and processing, which are part of descriptive statistics. It is the initial stage of statistical analysis before inferential statistics.

💡Inferential Statistics

Inferential statistics is the process of drawing conclusions or making inferences about a population based on a sample. The script mentions that after data is processed and analyzed, conclusions are drawn, and decisions are made, which is part of inferential statistics. However, the video focuses on descriptive statistics.

💡Data Collection

Data collection is the first step in the statistical process where data is gathered for analysis. The video script describes this as the initial phase of statistics, emphasizing its importance before any grouping, presentation, or analysis can occur.

💡Data Presentation

Data presentation involves organizing data in a way that is easy to understand, often using tables or diagrams. The script mentions various types of diagrams such as line charts, bar charts, and pie charts as examples of data presentation methods.

💡Data Processing

Data processing is the stage where raw data is refined and prepared for analysis. The video script includes this as part of the statistical process, where data is organized and made ready for analysis after collection and grouping.

Highlights

Welcome to the 'Science Window' channel, where the video discusses the first statistics of parking, including the definition of statistics and various types of data.

Statistics is a science related to data, which is a collection of descriptions or information obtained from an observation.

Data can be presented in various forms such as tables and diagrams, including line charts, bar charts, and pie charts.

Data is distinguished between singular (Tatum) and plural (Jamak) forms, with examples provided to illustrate the difference.

Data is categorized into qualitative and quantitative types, with qualitative data lacking numerical values and quantitative data consisting of numbers.

Quantitative data is further divided into discrete data, which is counted in whole numbers, and continuous data, which can have decimal values.

The process of statistics involves six stages: data collection, grouping, presentation, processing, analysis, and decision-making.

Descriptive statistics involves data collection, grouping, presentation, and processing, while inferential statistics includes data analysis and decision-making.

The video specifically discusses descriptive statistics and its stages, with inferential statistics to be covered in the second semester.

The importance of understanding the types of data and their applications in presenting and analyzing data is emphasized.

The video provides a comprehensive overview of the basics of statistics, suitable for middle school students who have learned about data presentation.

Examples such as students' heights and exam scores are used to explain the concepts of data and statistics.

The video encourages viewers to watch the complete playlist for more topics on this subject.

Viewers are invited to leave questions, suggestions, or criticisms in the comment section for further engagement.

The video concludes with a sign-off, looking forward to the next meeting, indicating the end of the content.

Transcripts

play00:00

Hai

play00:01

semua

play00:05

selamat datang di channel jendela sains

play00:08

di video ini kita akan membahas

play00:10

statistika parkir yang pertama yaitu

play00:13

tentang pengertian statistika dan

play00:15

jenis-jenis data simak terus video ini

play00:18

sampai akhir

play00:23

bicara mengenai statistika erat

play00:25

kaitannya dengan yang namanya data di

play00:28

SMP kalian sudah pernah belajar ya

play00:30

bagaimana menyajikan data baik dalam

play00:32

bentuk tabel maupun diagram-diagram nya

play00:35

pun ada bermacam-macam ada diagram garis

play00:38

diagram batang diagram lingkaran dan

play00:40

lain sebagainya oke memang betul

play00:43

statistika merupakan ilmu pengetahuan

play00:45

yang berkaitan dengan kata nah data itu

play00:48

apa sih data merupakan kumpulan

play00:51

Keterangan atau informasi yang diperoleh

play00:54

dari suatu pengamatan

play00:55

contohnya tinggi badan dari murid-murid

play01:00

Hai kelas 12 IPA 1 di suatu sekolah itu

play01:04

merupakan data karena berisi kumpulan

play01:06

Keterangan atau informasi yaitu apa ya

play01:09

tinggi badan mereka tinggi badannya Cia

play01:12

sekian cm tinggi badannya si B sekian

play01:15

centimeter dan seterusnya Oke data

play01:18

merupakan bentuk jamak sedangkan bentuk

play01:21

tunggalnya disebut Tatum Jadi kalau data

play01:24

kan tadi kumpulan kalau sudah tumbuh

play01:26

seperti ini misalkan Budi adalah salah

play01:30

satu murid dari kelas 12 IPA 1 tinggi

play01:33

badannya 160 cm maka tinggi badannya

play01:36

Budi 160 cm itu disebut Tatum karena

play01:40

tunggal cuman satu tapi kalau tinggi

play01:42

badannya putih sudah digabung dengan

play01:44

tinggi badan murid sekelas membentuk

play01:46

kumpulan tinggi badan dari murid-murid

play01:49

kelas 12 IPA 1 makan namanya itu data

play01:51

Jadi inget ya katup itu tunggal kalau

play01:54

data itu jamak karena kumpulan-kumpulan

play01:57

Keterangan atau informasi lain hai oke

play02:01

data dapat dibedakan menjadi dua yaitu

play02:04

data kualitatif dan data kuantitatif

play02:07

Apa bedanya Ya seperti asal katanya

play02:10

kalau kualitatif itu enggak ada angkanya

play02:13

enggak ada bilangannya jadi datanya

play02:15

Hanya berupa kategori atau atribut

play02:18

misalnya berhasil dan gagal ya dan tidak

play02:21

baik dan rusak kalau kita Tambahkan lagi

play02:24

lulus atau remidi itu juga merupakan

play02:26

data kualitatif Oke berikutnya data

play02:29

kuantitatif ini merupakan data yang

play02:32

berupa bilangan contohnya nilai ulangan

play02:35

matematika murid-murid kelas 12 IPA 1 ya

play02:38

ketikan ada angkat yang 70 75 78 itu

play02:43

data kuantitatif tapi ada juga gini

play02:45

misalkan nilainya gak ada tapi hanya ada

play02:47

lulus atau remidi itu sudah masuk data

play02:50

kualitatif jadi paham ya data

play02:53

kuantitatif itu ada bilangannya kalau

play02:55

data kualitatif itu tidak ada

play02:57

bilangannya jadi Hanya berupa atribut

play03:00

kategori yang mana yang lulus yang mana

play03:02

yang remidi yang mana yang berhasil yang

play03:05

mana yang gagal Yang mana Yang ya Yang

play03:07

mana yang tidak yang mana yang baik yang

play03:09

mana yang rusak dan seterusnya Oke

play03:12

berikutnya data kuantitatif dapat

play03:15

dibedakan lagi menjadi dua yaitu data

play03:18

diskrit atau data cacahan dan yang kedua

play03:21

data kontinu atau data ukuran Apa

play03:24

bedanya gini kalau data diskrit atau

play03:27

data cacahan itu merupakan data yang

play03:29

diperoleh dengan cara menghitung atau

play03:32

mencacah misalnya jumlah saudara kandung

play03:35

Ya jumlah saudara kandungan dihitung 123

play03:38

nggak mungkin jumlah saudara kandung itu

play03:41

koma dua koma tiga 2,5 nggak mungkin

play03:44

ngerti ya kalau misalkan data kontinu

play03:47

atau data ukuran itu merupakan data yang

play03:50

diperoleh dengan cara mengukur misalnya

play03:54

tinggi badan berat badan kalau misalkan

play03:56

tinggi badan berat badan ikan bisa koma

play04:00

ya sebenarnya tergantung dari ketelitian

play04:02

alat ukur yang digunakan

play04:04

bisa jadi enggak ada komanya habis 160

play04:07

161 162 dan seterusnya tapi kalau

play04:11

misalkan kita gunakan alat yang lebih

play04:13

teliti bisa juga tinggi badan maupun

play04:17

berat badan itu ada komanya bisa 161

play04:20

koma 57 atau misalkan berat badan

play04:24

59,5 part 7 kg bisa jadi seperti itu

play04:28

jadi disini jelas ya perbedaannya adalah

play04:30

kalau data diskrit itu dihitung

play04:33

1234 dan seterusnya kalau data kontinu

play04:36

itu diukur ada alat ukurnya tinggi badan

play04:39

alat ukurnya itu berarti kan pakai

play04:41

meteran ya berat badan pakai Timbangan

play04:43

dan seterusnya ya karena diukur berarti

play04:46

bisa menghasilkan angka yang koma koma

play04:49

tergantung ketelitian alat ukur yang

play04:51

digunakan

play04:52

Oke

play04:55

Nah tadi statistik akan kita belajar ya

play04:58

merupakan ilmu biasanya berkaitan dengan

play05:01

katak disini saya berikan Bagaimana

play05:04

tahap-tahap statistika yang pertama

play05:06

adalah pengumpulan data jadi data

play05:08

dikumpulkan terlebih dahulu kemudian

play05:10

setelah data terkumpul maka data

play05:13

tersebut dikelompokkan kata yang masih

play05:16

mentah itu dikelompokkan setelah

play05:18

dikelompokkan maka data itu disajikan

play05:21

penyajian data penyajian data seperti

play05:24

tadi sempat saya singgung ya bisa dalam

play05:26

bentuk tabel maupun diagram nah kemudian

play05:29

setelah penyajian data maka data

play05:31

tersebut diolah pengolahan data setelah

play05:34

data diolah maka dilakukan analisis

play05:37

analisis data untuk menarik suatu

play05:40

kesimpulan

play05:41

kalau misalkan sudah ada kesimpulannya

play05:43

maka tahap berikutnya adalah pengambilan

play05:46

keputusan Oke jadi dari enam tahap

play05:50

statistika ini secara umum dibagi

play05:52

menjadi dua kelompok sebenarnya kelompok

play05:55

pertama adalah mulai pengumpulan

play05:56

pengelompokan penyajian dan pengolahan

play05:59

data disebut statistika deskriptif Oke

play06:03

sedangkan yang analis data atau

play06:05

penarikan kesimpulan serta pengambilan

play06:07

keputusan ini disebut statistika

play06:10

inferensial Oke untuk yang dibaptis ini

play06:14

kita khusus membahas statistika

play06:15

deskriptif saja jadi kita akan bahas

play06:18

mulai dari pengumpulan data

play06:19

pengelompokan data penyajian data dan

play06:22

pengolahan data untuk yang statistika

play06:25

inferensial ini dibahas nanti di

play06:27

semester dua oke

play06:31

oke sekian untuk video kali ini untuk

play06:34

melihat playlist lengkap dari bab ini

play06:37

bisa kalian Klik tombol yang ada di

play06:39

sebelah kanan atas ini jika ada

play06:41

pertanyaan saran maupun kritik bisa

play06:44

kalian tulis di kolom komentar semoga

play06:47

bermanfaat dan sampai jumpa divideo

play06:49

selanjutnya dadaa

Rate This

5.0 / 5 (0 votes)

相关标签
StatisticsData TypesVisualizationEducationalDescriptiveInferentialData AnalysisDiagramsChartsQuantitativeQualitative
您是否需要英文摘要?