Menggambar fungsi piecewise, linear dan kuadrat, by Top Mat
Summary
TLDRIn this educational video, the instructor teaches how to graph piecewise functions, focusing on a quadratic function and a linear function. The quadratic function is analyzed step by step, including finding its vertex, intercepts, and domain restrictions. The process of graphing the function is explained, emphasizing symmetry and key points. The second part covers graphing a linear function, using only two points and illustrating how to identify open and closed circles on the graph. The instructor encourages students to share their learning and explains the benefits of teaching others to reinforce knowledge.
Takeaways
- 😀 The lesson focuses on drawing piecewise functions, combining quadratic and linear functions on a single Cartesian plane.
- 😀 The first function is a quadratic: y = -x² + 4, with a domain x ≤ 1.
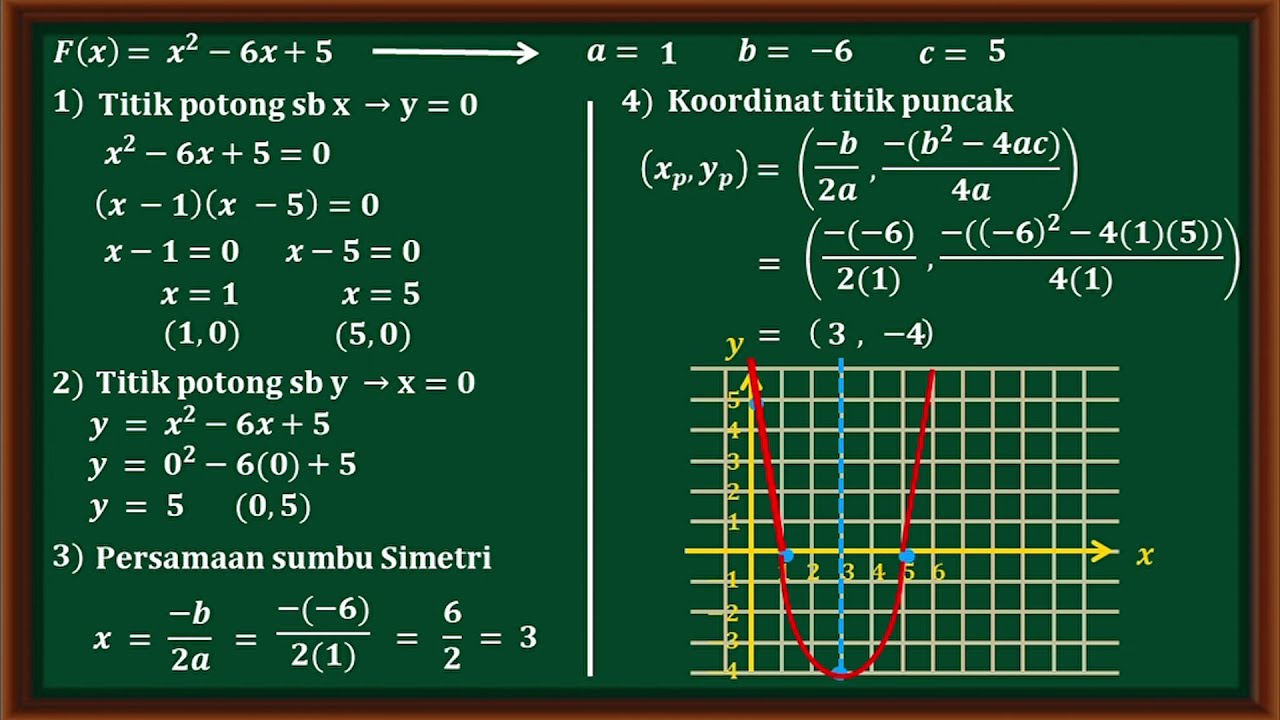
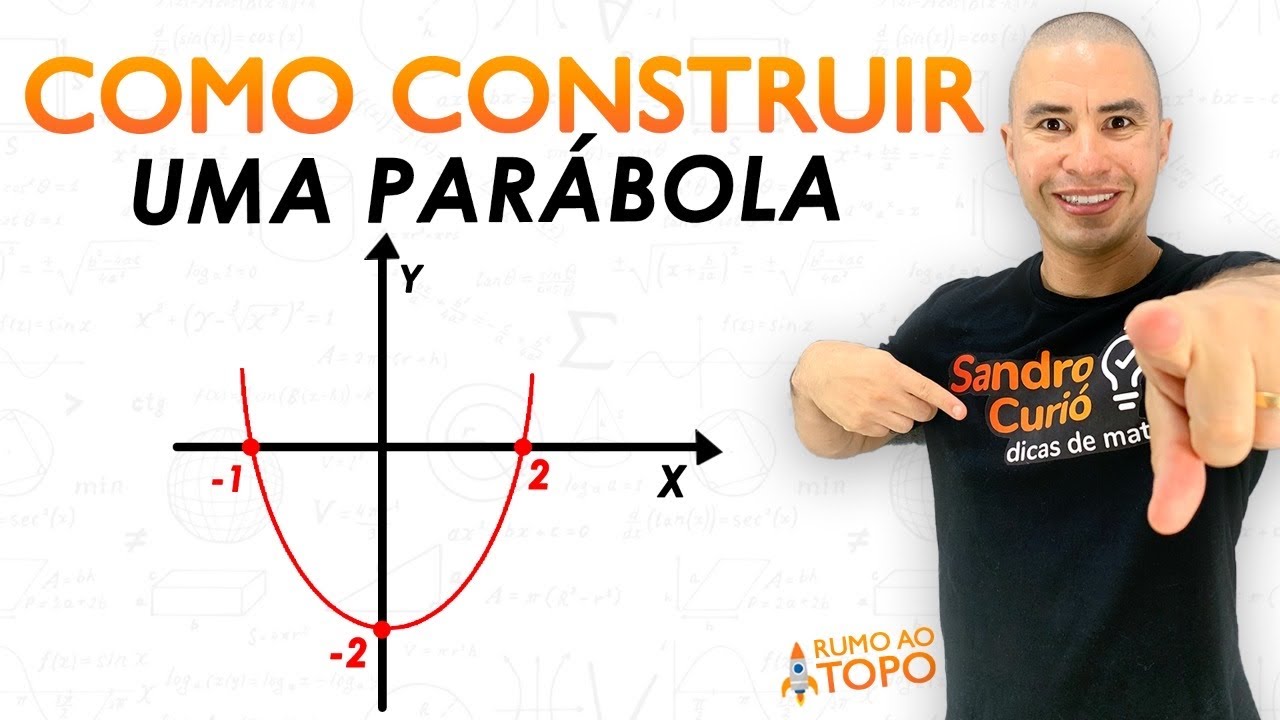
- 😀 For the quadratic, the parabola opens downward because the coefficient of x² is negative.
- 😀 The vertex of the quadratic is calculated using x_vertex = -b / 2a, resulting in the point (0, 4).
- 😀 The quadratic intersects the x-axis at points (-2, 0) and (2, 0), but the domain limits the graph to x ≤ 1.
- 😀 The endpoint at x = 1 is plotted as a filled circle (included in the domain) at (1, 3).
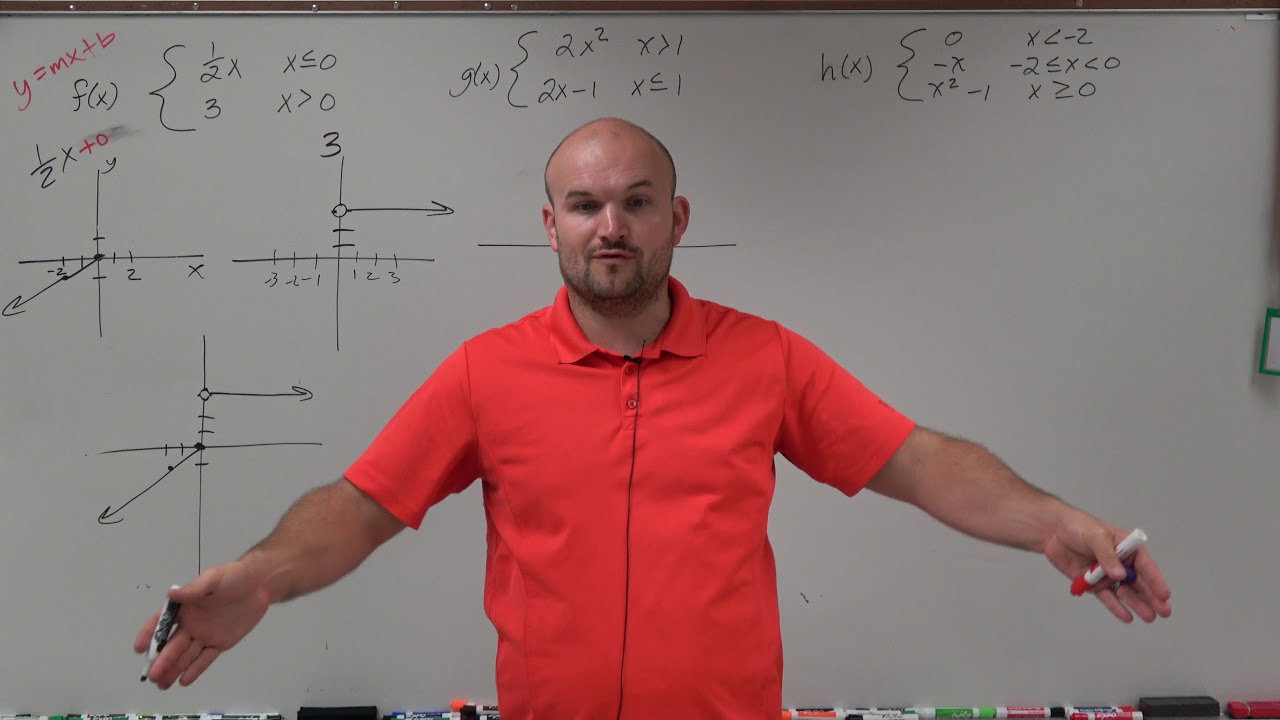
- 😀 The second function is linear: y = 3x, with a domain x > 1.
- 😀 For the linear function, two points are sufficient to draw the graph: (1, 3) as an open circle and (2, 6) as a regular point.
- 😀 Open and filled circles indicate whether endpoints are included or excluded in the domain.
- 😀 Combining these two functions creates a piecewise function, and software like GeoGebra can be used for precise graphing.
- 😀 The instructor encourages students to share knowledge, explain to others, and engage actively to deepen understanding.
Q & A
What is the first function introduced in the video and its domain?
-The first function is a quadratic function, y = -x² + 4, with the domain x ≤ 1.
How do you determine the direction of the parabola for a quadratic function?
-The direction of the parabola is determined by the coefficient 'a' of x². If a > 0, it opens upward; if a < 0, it opens downward. Here, a = -1, so the parabola opens downward.
How is the vertex of a quadratic function calculated?
-The vertex (x, y) is calculated using x = -b/(2a) and y by substituting x into the function. For y = -x² + 4, b = 0, so x_vertex = 0 and y_vertex = 4, giving the vertex (0, 4).
What are the x-intercepts of the quadratic function y = -x² + 4?
-The x-intercepts are found by setting y = 0: -x² + 4 = 0 → x² = 4 → x = ±2. So the x-intercepts are (-2, 0) and (2, 0).
How is the endpoint of the quadratic function determined considering the domain?
-The endpoint is found by substituting the domain boundary x = 1 into the function: y = -1² + 4 = 3, giving the endpoint (1, 3).
What is the second function introduced in the video and its domain?
-The second function is a linear function, y = 3x, with the domain x > 1.
How many points are needed to draw a linear function and why?
-Two points are sufficient to draw a linear function because a straight line is uniquely determined by two points. In this video, the points chosen are (1, 3) and (2, 6).
What is the difference between a solid circle and an open circle when plotting piecewise functions?
-A solid circle indicates that the point is included in the domain (≤ or ≥), while an open circle indicates the point is excluded from the domain (< or >).
How do you combine the quadratic and linear functions into a single piecewise function?
-By defining each function over its respective domain: f(x) = -x² + 4 for x ≤ 1 and f(x) = 3x for x > 1.
Why does the video recommend sharing knowledge with others?
-Sharing knowledge reinforces understanding, helps others learn, and allows one’s own knowledge to grow through teaching.
What tools are suggested to help draw the functions accurately?
-The video suggests using Geogebra or similar graphing software to plot functions accurately.
What is the significance of symmetry in the quadratic graph?
-The parabola is symmetric about the vertex, which ensures the shape is balanced on both sides of the vertex, aiding in accurate plotting.
Outlines

此内容仅限付费用户访问。 请升级后访问。
立即升级Mindmap

此内容仅限付费用户访问。 请升级后访问。
立即升级Keywords

此内容仅限付费用户访问。 请升级后访问。
立即升级Highlights

此内容仅限付费用户访问。 请升级后访问。
立即升级Transcripts

此内容仅限付费用户访问。 请升级后访问。
立即升级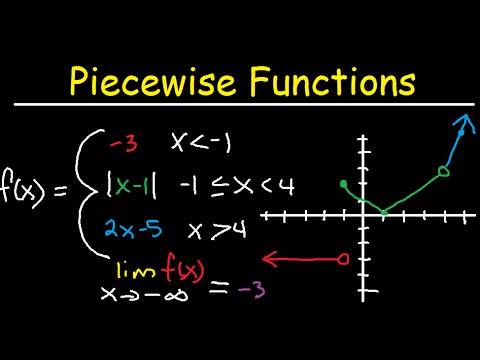
5.0 / 5 (0 votes)
