Functions and Graphs | Precalculus
Summary
TLDRThis video provides a comprehensive review of functions and graphs, covering key topics like evaluating functions, absolute value equations, the vertical line test, and domain/range analysis. The tutorial walks through various multiple-choice problems, explaining concepts such as the relative maximum and minimum of a function, intervals of increase and decrease, and interpreting piecewise functions. Key mathematical techniques like solving for x in equations and determining the difference quotient are also highlighted, making this an excellent resource for students looking to strengthen their understanding of functions and graph analysis.
Takeaways
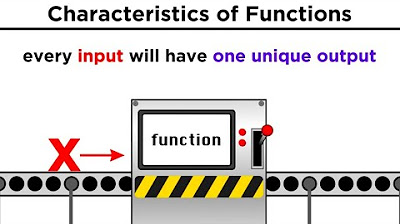
- 😀 To evaluate a function at a given x-value, substitute x into the function and simplify step by step.
- 😀 When solving f(x) = value problems, isolate x and consider absolute values or multiple possible solutions.
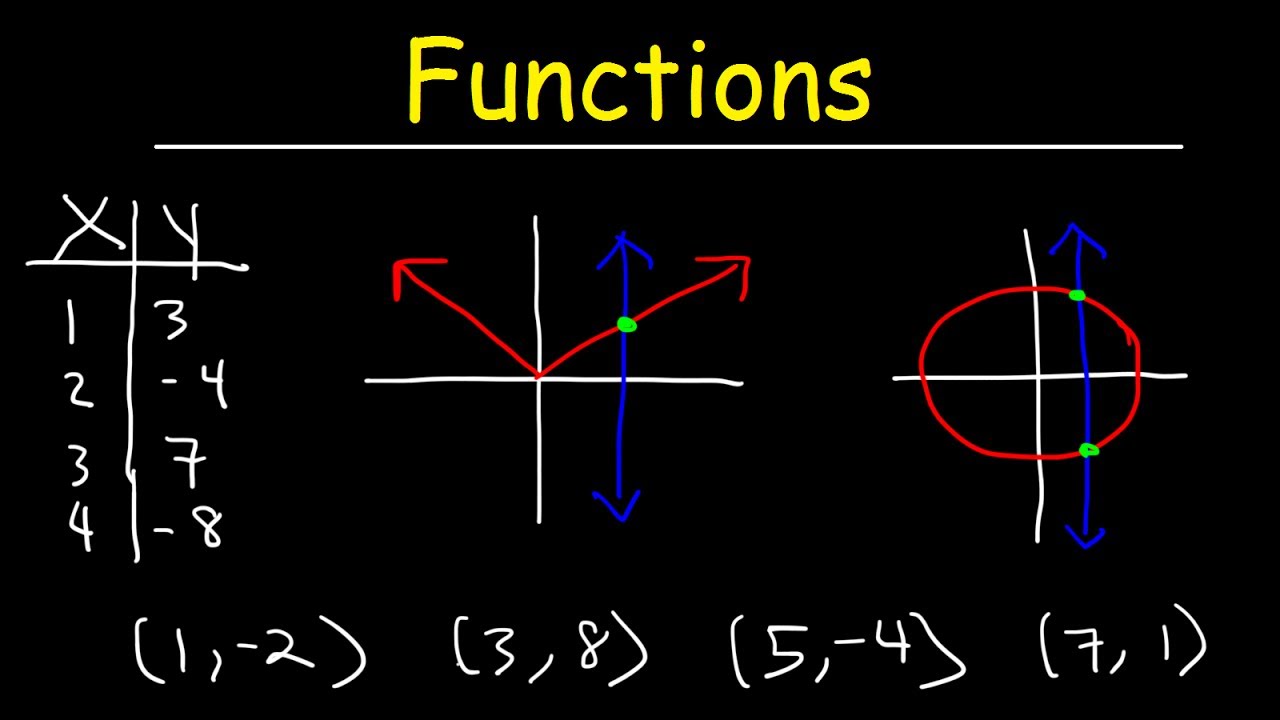
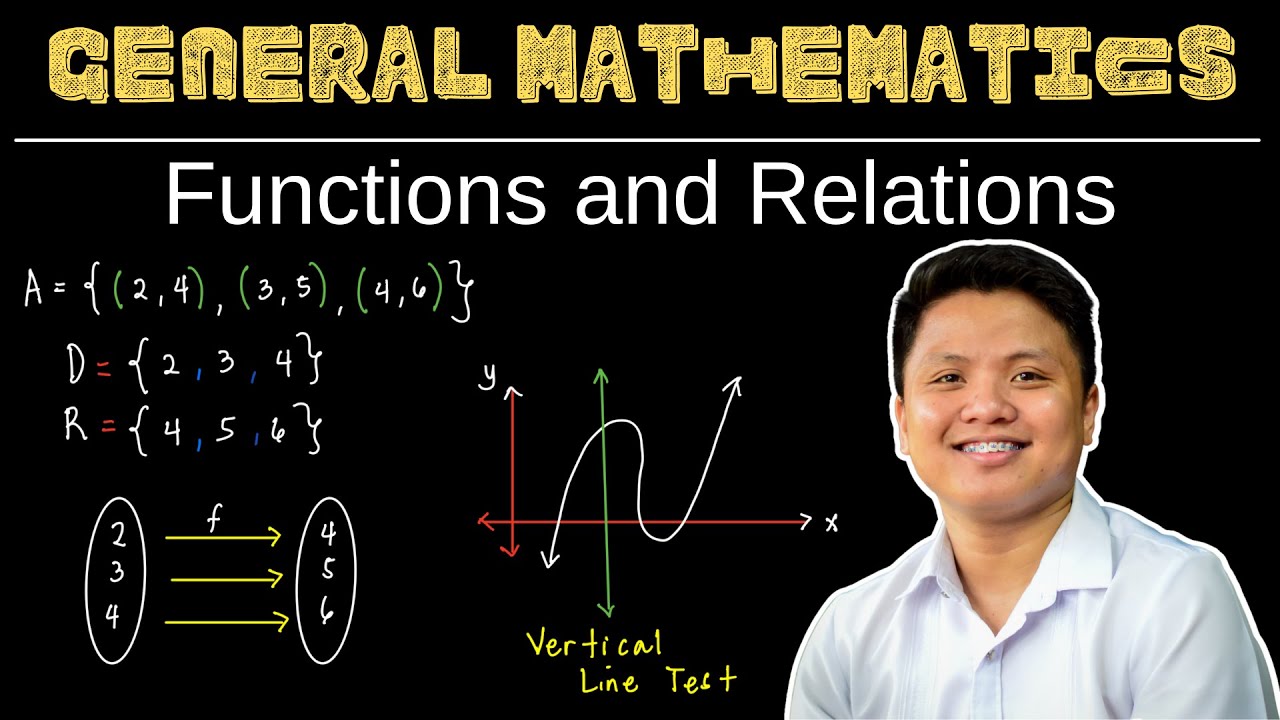
- 😀 Use the vertical line test to determine whether a graph represents a function: each vertical line must intersect the graph at most once.
- 😀 To find f(x) from a graph, identify the y-coordinate corresponding to the given x-coordinate.
- 😀 Intervals of increase, decrease, and constant behavior are determined by observing how y-values change as x increases.
- 😀 Relative maxima are local high points (hills), and relative minima are local low points (valleys); use x-coordinates for location and y-coordinates for value.
- 😀 For piecewise functions, select the correct expression based on the x-interval before evaluating.
- 😀 Domain represents all possible x-values of a function, and range represents all possible y-values; use interval notation and include or exclude endpoints correctly.
- 😀 The difference quotient formula is (f(x+h) - f(x)) / h, and simplification may involve multiplying by the conjugate when radicals are present.
- 😀 Step-by-step arithmetic and careful attention to positive/negative signs are crucial for accurate function evaluation and solving equations.
- 😀 Graph analysis skills, including reading exact points and understanding function behavior, are essential for interpreting and solving function-related problems.
Q & A
How do you evaluate a function at a specific value of x?
-To evaluate a function at a specific x-value, replace x in the function with the given value and simplify the expression to find the corresponding y-value.
What steps are involved in solving an equation involving absolute values?
-First, isolate the absolute value expression. Then, set up two separate equations: one with the expression equal to the positive value and one equal to the negative value. Solve each equation for x to find all possible solutions.
What is the Vertical Line Test and how is it used to determine if a graph represents a function?
-The Vertical Line Test states that if any vertical line intersects a graph at more than one point, the graph does not represent a function. A graph represents a function if every vertical line intersects it at most once.
How can you determine the value of a function at a given x-value from a graph?
-Locate the x-value on the horizontal axis, then find the corresponding point on the curve. The y-coordinate of that point is the value of the function at that x-value.
What is the relationship between f(x) and y in function notation?
-In function notation, f(x) represents the output or dependent variable, which is equivalent to y. So, f(x) = y, and for a given x, f(x) gives the corresponding y-value.
How do you identify intervals where a function is increasing, decreasing, or constant?
-A function is increasing where the y-values rise as x increases, decreasing where the y-values fall as x increases, and constant where the y-values remain the same. Examine the graph and use x-values to define these intervals.
How do you find the relative maximum and minimum of a function from its graph?
-The relative maximum is the highest point in a particular region of the graph (a 'hill'), and the relative minimum is the lowest point (a 'valley'). Identify the x-coordinate of these points for location and the y-coordinate for the value.
How do you evaluate a piecewise function at a given x-value?
-Determine which piece of the function applies to the given x-value based on the defined intervals. Then, substitute the x-value into that specific piece and simplify to find f(x).
How can the domain and range of a function be expressed using interval notation and inequalities?
-The domain represents all possible x-values, and the range represents all possible y-values. Use interval notation with parentheses for open intervals and brackets for closed intervals. Alternatively, express them with inequalities to describe the values that x or y can take.
What is the difference quotient, and how is it simplified for a function involving a square root?
-The difference quotient is (f(x+h) - f(x)) / h and represents the average rate of change of the function. For functions with square roots, multiply numerator and denominator by the conjugate of the numerator to simplify and cancel h.
Why is it important to pay attention to x-values, not y-values, when defining intervals of increase, decrease, or constancy?
-Intervals are defined by the input variable x because they describe the sections of the domain over which the function behaves in a particular way. Y-values indicate output, but the intervals are determined by the corresponding x-values.
Outlines

此内容仅限付费用户访问。 请升级后访问。
立即升级Mindmap

此内容仅限付费用户访问。 请升级后访问。
立即升级Keywords

此内容仅限付费用户访问。 请升级后访问。
立即升级Highlights

此内容仅限付费用户访问。 请升级后访问。
立即升级Transcripts

此内容仅限付费用户访问。 请升级后访问。
立即升级浏览更多相关视频
Functions - Vertical Line Test, Ordered Pairs, Tables, Domain and Range
Relations and Functions | General Mathematics | Grade 11
Back to Algebra: What are Functions?
THE LANGUAGE OF RELATIONS AND FUNCTIONS || MATHEMATICS IN THE MODERN WORLD

Matematika SMA - Relasi dan Fungsi (1) - Pengertian Relasi dan Fungsi, Domain Fungsi (A)

Relations & Functions
5.0 / 5 (0 votes)
