Forecasting (7): Forecast accuracy measures (MSE, RMSE, MAD & MAPE)
Summary
TLDRThis video explains various accuracy measures used to evaluate forecasting performance. It covers key metrics like Mean Squared Error (MSE), Root Mean Squared Error (RMSE), Mean Absolute Deviation (MAD), and Mean Absolute Percentage Error (MAPE). The video highlights how each metric works, focusing on error calculations and their implications. The presenter also discusses the limitations of these metrics, such as potential bias based on sample periods, and introduces Mean Absolute Scaled Error (MASE) as a more balanced measure. Practical demonstrations of these concepts in Excel will follow in future videos.
Takeaways
- 😀 Forecast accuracy is critical to evaluate how well predictions perform against actual values.
- 😀 Mean Squared Error (MSE) measures forecast accuracy by calculating the squared difference between forecasted and actual values, and averaging the results.
- 😀 Root Mean Squared Error (RMSE) is simply the square root of MSE and is one of the most commonly used measures for forecast accuracy.
- 😀 Mean Absolute Deviation (MAD) calculates the average absolute difference between the forecasted and actual values, ignoring sign (positive or negative).
- 😀 Mean Absolute Percentage Error (MAPE) is a preferred method, where the absolute error is divided by the actual value and then averaged, giving a percentage-based result.
- 😀 MAPE is considered an excellent indicator of forecast performance when the error is below 10-15%, and very good forecasts should have less than 5% error.
- 😀 There is a potential issue with bias in these accuracy measures, as the number of sample periods used can influence the results (e.g., a model that performs well with 20 periods may perform differently with 30 periods).
- 😀 Researchers have suggested an alternative measure called MASE (Mean Absolute Scaled Error) to address this bias, comparing the forecast to a naïve forecast for better scaling.
- 😀 Forecast accuracy measures, such as MSE, RMSE, MAD, and MAPE, are essential tools for assessing how well a forecasting model is working.
- 😀 The script hints at upcoming lessons where forecast models will be demonstrated and how to calculate them using Excel.
Q & A
What is the main purpose of measuring forecast accuracy?
-The main purpose of measuring forecast accuracy is to evaluate how well a forecast performs by comparing the forecasted values against the actual values. It helps assess the effectiveness of the forecasting model.
What does MSE (Mean Squared Error) measure?
-MSE measures the average of the squared differences between the forecasted and actual values. It calculates the error by taking the difference, squaring it, and then averaging all the squared errors.
Why is the MSE a useful metric for forecast accuracy?
-MSE is useful because it provides a clear indication of the magnitude of errors in the forecast. However, it is sensitive to large errors since the error terms are squared.
What is the difference between MSE and RMSE?
-RMSE (Root Mean Squared Error) is the square root of MSE. While MSE gives the average squared error, RMSE provides a measure of error in the original units of the data, making it more interpretable.
What is the advantage of using RMSE over MSE?
-The advantage of using RMSE is that it is in the same units as the original data, making it easier to understand and interpret the forecast error compared to MSE, which can be harder to relate to the data.
How does Mean Absolute Deviation (MAD) differ from MSE and RMSE?
-Unlike MSE and RMSE, MAD uses the absolute value of the differences between actual and forecasted values. This means MAD does not penalize large errors as much as MSE and RMSE do.
Why is MAPE (Mean Absolute Percentage Error) a popular metric?
-MAPE is popular because it provides an error measure in percentage terms, making it easy to understand the relative error compared to the actual values. A MAPE below 10% is often considered a good forecast.
How is MAPE calculated?
-MAPE is calculated by first taking the absolute difference between the forecasted and actual values, dividing it by the actual value to find the percentage error, and then averaging these values over the entire forecast period.
What is the typical threshold for a good forecast according to MAPE?
-A good forecast typically has a MAPE of less than 10%, while a very good forecast can have a MAPE of under 5%.
What is the role of the Mean Absolute Scaled Error (MASE)?
-MASE compares the forecasted values against a 'naive' forecast. If the forecast performs better than the naive forecast, it is considered better. This helps avoid bias that can arise from different sample sizes or scales.
Outlines

此内容仅限付费用户访问。 请升级后访问。
立即升级Mindmap

此内容仅限付费用户访问。 请升级后访问。
立即升级Keywords

此内容仅限付费用户访问。 请升级后访问。
立即升级Highlights

此内容仅限付费用户访问。 请升级后访问。
立即升级Transcripts

此内容仅限付费用户访问。 请升级后访问。
立即升级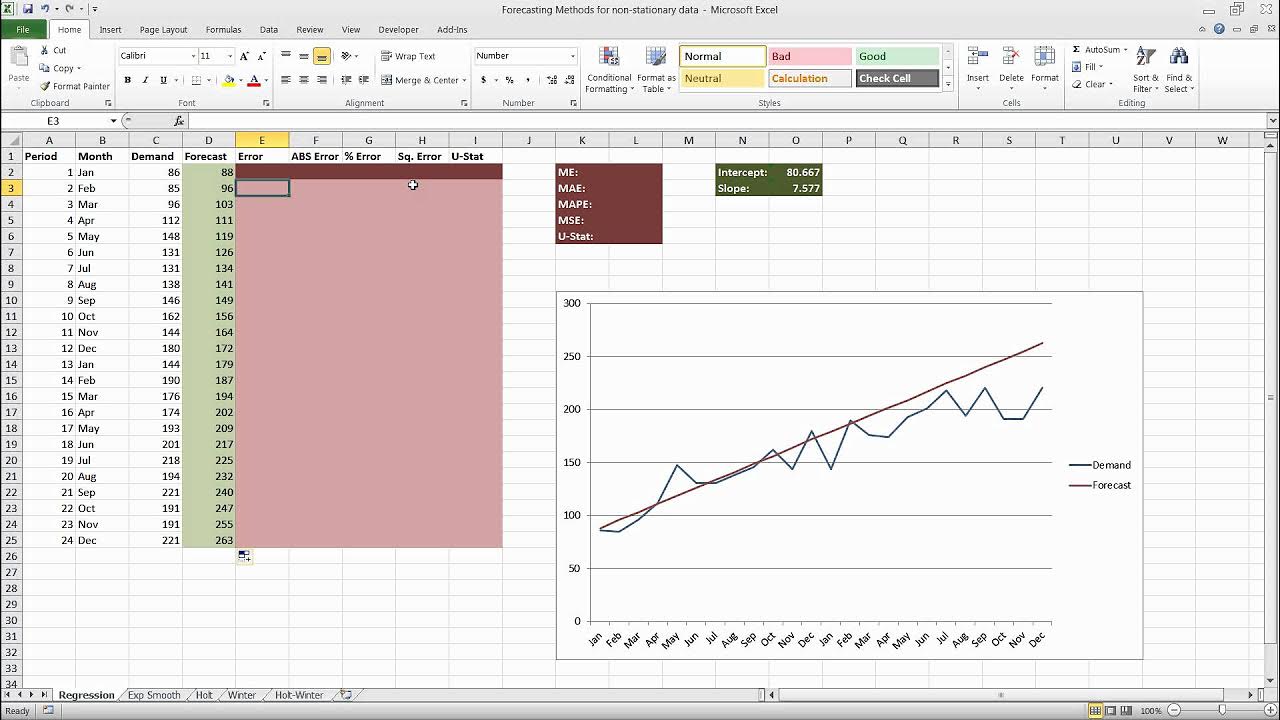


5.0 / 5 (0 votes)
