Map Projections Explained - A Beginners Guide
Summary
TLDRIn this beginner-friendly video, Chris from Mango explains map projections, focusing on how spherical objects like the Earth are transformed into flat maps. He highlights the distortions that arise, especially in the popular Web Mercator projection, where areas near the poles are exaggerated. Through practical examples, such as comparing the size of Greenland and Africa, and demonstrating how circles of equal radius distort at different latitudes, the video illustrates the real-world impact of these projections on map measurements. By the end, viewers gain a better understanding of the importance of map projections in accurate mapping and measurements.
Takeaways
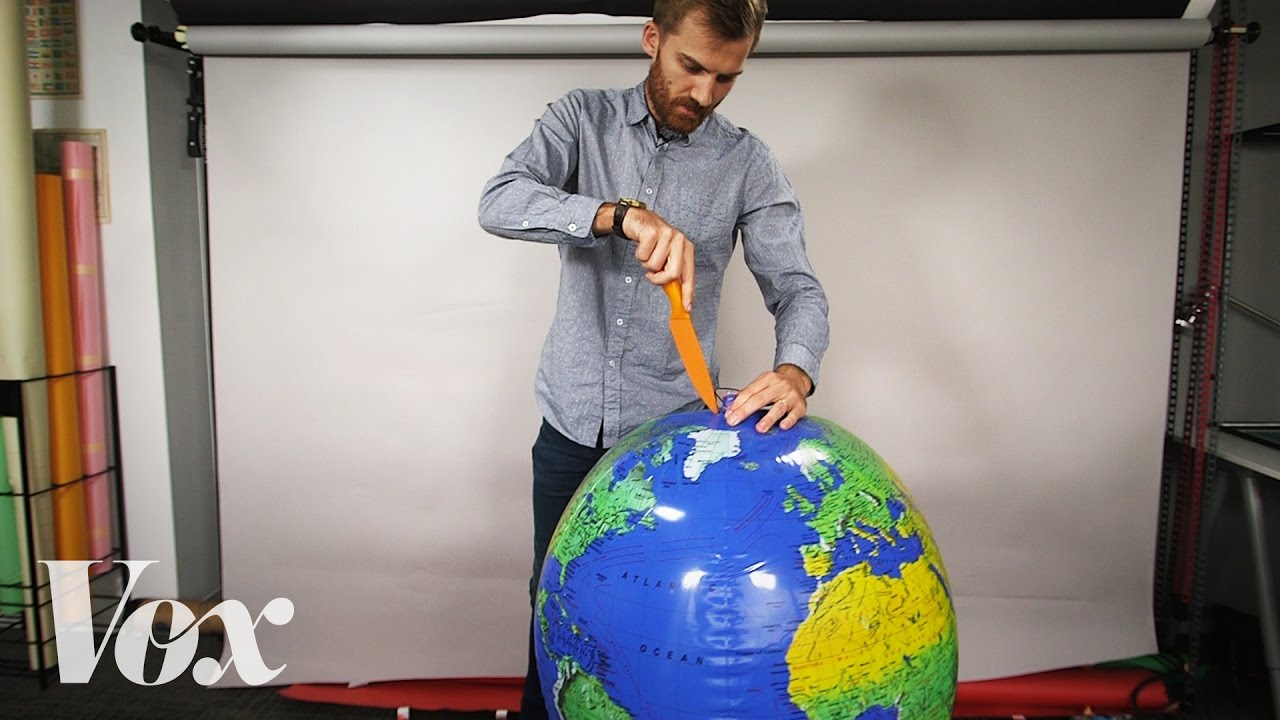
- 😀 Map projections are the process of transforming a spherical object, like the Earth, into a two-dimensional flat surface.
- 😀 Map projections involve mathematical equations that account for how to represent the Earth's spherical surface on a flat map, introducing various distortions.
- 😀 Distortions in map projections can affect distances, areas, shapes, and directions, and are inevitable when flattening a 3D object onto a 2D surface.
- 😀 Projections are often a compromise between maintaining accurate distances, areas, shapes, or directions, depending on the purpose of the map.
- 😀 The Web Mercator projection is one of the most common map projections, used by platforms like Google Maps.
- 😀 The Web Mercator projection distorts polar regions, making landmasses like Greenland appear much larger than they are in reality.
- 😀 Greenland appears nearly the same size as Africa in the Web Mercator projection, but in reality, it is much smaller.
- 😀 Projections affect map measurements, such as the size and shape of circles drawn on maps at different latitudes.
- 😀 A 500 km circle near Greenland appears much larger than the same-sized circle near the equator, due to projection distortions.
- 😀 Distortions in projections can make shapes like circles appear as egg shapes, as seen in a 500 km circle drawn in northern Canada.
- 😀 Tools like the geodesic circle plugin can help visualize the impact of projection distortions, showing how distances appear smaller near the equator and larger near the poles.
Q & A
What is a map projection?
-A map projection is the process of transforming a spherical object, like the Earth, into a 2D flat surface. This involves mathematical equations that manage distortions when flattening the sphere into a rectangle or square.
What are some common distortions introduced by map projections?
-Map projections often introduce distortions in measurements such as distance, area, shape, and direction. These distortions occur because it's impossible to perfectly flatten a 3D object (the Earth) into 2D without altering some properties.
Why is the Web Mercator projection so commonly used?
-The Web Mercator projection is widely used by web mapping systems, like Google Maps, due to its efficiency in handling storage and speed for sending map tiles across the internet, despite its distortions at the poles.
What are the distortions of the Web Mercator projection?
-The Web Mercator projection causes significant distortion at the poles, making landmasses like Greenland appear much larger than they actually are, and this distortion becomes more pronounced as you move further from the equator.
How does the size of Greenland appear in the Web Mercator projection?
-In the Web Mercator projection, Greenland appears nearly the same size as Africa, even though in reality, Greenland is much smaller than Africa. This distortion is a result of the projection stretching landmasses near the poles.
What is the impact of map projection distortions on measurements like area and distance?
-Map projection distortions can cause inaccuracies in the way distances, areas, and shapes are represented. For instance, a circle with a fixed radius (like 500 km) may appear much larger in some regions due to these distortions, affecting the accuracy of map-based measurements.
How can distortions affect a circle's appearance on a map?
-Distortions in map projections can cause a circle to appear as an ellipse or egg shape, especially near the poles. This is due to the stretching of the map to fit the 2D plane, even though the actual radius remains constant.
What is the significance of the demonstration with the circles in Mexico and Canada?
-The demonstration highlights how projections distort circles differently depending on their location. While the circles in both Mexico and Canada are intended to have the same radius, the one in Canada appears larger and more distorted due to the projection's stretching effect near the poles.
What is the purpose of the geodesic circle plugin for Leaflet?
-The geodesic circle plugin for Leaflet helps demonstrate the impact of projection distortions by showing how a 1,000 km circle appears differently depending on its position relative to the equator or the poles.
Why is understanding map projections important for map users and creators?
-Understanding map projections is crucial because distortions can significantly impact the accuracy of visual representations, measurements, and spatial analysis. Knowing how projections work helps users and creators make informed decisions when interpreting or designing maps.
Outlines

此内容仅限付费用户访问。 请升级后访问。
立即升级Mindmap

此内容仅限付费用户访问。 请升级后访问。
立即升级Keywords

此内容仅限付费用户访问。 请升级后访问。
立即升级Highlights

此内容仅限付费用户访问。 请升级后访问。
立即升级Transcripts

此内容仅限付费用户访问。 请升级后访问。
立即升级


5.0 / 5 (0 votes)
