Tugas Jurnal Mata Kuliah SIG
Summary
TLDRThis presentation discusses a study on mapping flood-prone areas in Bondowoso, Indonesia, using Geographic Information Systems (GIS). The research highlights the importance of considering disaster risks, especially floods, in regional development. By analyzing various factors like elevation, rainfall, and land use, the study identifies areas at risk of flooding. Results show that 74.1% of the region is considered safe, while 25.89% is vulnerable to flooding. The findings aim to assist in making informed decisions for safe development, including residential and industrial zones.
Takeaways
- 😀 Introduction of the presentation by Musadatad Syarif and Berliana Andini Silviana on flood-prone mapping in Bondowoso.
- 😀 The study focuses on using Geographic Information Systems (GIS) to identify flood-prone areas in Bondowoso to support development planning.
- 😀 74.10% of Bondowoso's area is considered safe from floods, while 25.89% is identified as flood-prone.
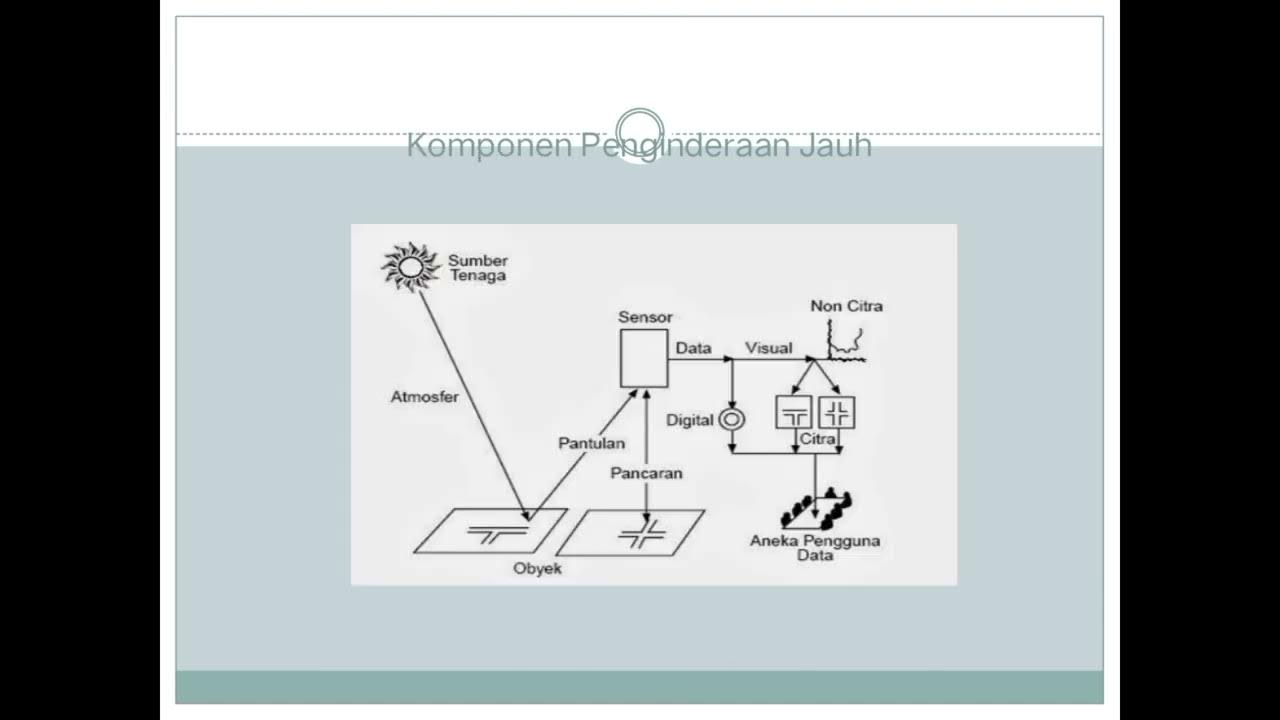
- 😀 GIS technology is utilized to map flood-prone areas using scoring and overlay methods based on thematic maps.
- 😀 The study emphasizes the importance of incorporating flood risk in regional development planning, particularly for settlements and infrastructure.
- 😀 The research aims to provide information on flood zones to help local government and community decision-making processes.
- 😀 The study area is focused on the administrative region of Bondowoso, considering key parameters such as slope, elevation, rainfall, and land use.
- 😀 The research involves three stages: preparation, data collection and processing, and final analysis leading to flood-prone area zoning.
- 😀 Scoring and overlay methods are applied to combine spatial and non-spatial data, such as elevation, slope, and land use, to determine flood risk zones.
- 😀 The final output includes flood-prone area maps and recommendations for safe areas suitable for development based on flood risk analysis.
Q & A
What is the main objective of the study presented in the journal?
-The main objective of the study is to map flood-prone areas in Bondowoso Regency using Geographic Information Systems (GIS) to assist in the feasibility study of development areas by considering flood risks.
What percentage of Bondowoso's area is considered safe from floods according to the study?
-According to the study, 74.10% of Bondowoso's area is considered safe from floods.
What percentage of Bondowoso's area is at risk of flooding?
-The study found that 25.89% of Bondowoso's area is at risk of flooding.
Which factors were considered in the analysis to determine flood-prone areas?
-The analysis considered four key factors: slope, elevation, rainfall, and land use.
How were the data parameters combined in the study?
-The data parameters were combined using the GIS overlay method, where various thematic maps (slope, elevation, rainfall, and land use) were overlaid and scored to create flood-prone zones.
What was the role of GIS technology in this study?
-GIS technology played a crucial role in processing and analyzing spatial and non-spatial data to identify and map flood-prone areas using methods like overlay and scoring.
What is the significance of the flood hazard map created in this study?
-The flood hazard map is significant as it provides a visual representation of flood-prone areas, which serves as an informational tool for the public and policymakers, helping in the decision-making process for development projects.
What are the key recommendations for development in flood-prone areas based on the study?
-The study recommends that development should focus on areas identified as safe, avoiding flood-prone regions, particularly those with low elevation, low slope, high rainfall, and altered land cover.
How were the flood-prone areas categorized in the study?
-The flood-prone areas were categorized into two zones: 'safe' (green areas) and 'flood-prone' (red areas). Safe areas had a high slope, good elevation, and healthy land cover, while flood-prone areas had lower slopes and higher rainfall.
What tools and software were used in the study for data analysis?
-The study used GIS software for spatial data analysis and Microsoft Office for data processing, along with hardware like laptops and printers for processing and mapping.
Outlines

此内容仅限付费用户访问。 请升级后访问。
立即升级Mindmap

此内容仅限付费用户访问。 请升级后访问。
立即升级Keywords

此内容仅限付费用户访问。 请升级后访问。
立即升级Highlights

此内容仅限付费用户访问。 请升级后访问。
立即升级Transcripts

此内容仅限付费用户访问。 请升级后访问。
立即升级浏览更多相关视频
Popy X 1 Dasar Pemetaan Indera SIG Geo X Regulasi Diri

Apa perbedaan SaIG dan SIG? | SAIG2B
Pengolahan Citra Penginderaan Jauh untuk jaringan transportasi
Sistem Informasi Geografis | Geografi Kelas 10 - KHATULISTIWA MENGAJAR

Pemanfaatan SIG untuk kajian Kesehatan Lingkungan

Sesi 2 - Konsep Teknologi Informasi Di Bidang Kesehatan
5.0 / 5 (0 votes)
