[1] Penyajian Data (Tabel)
Summary
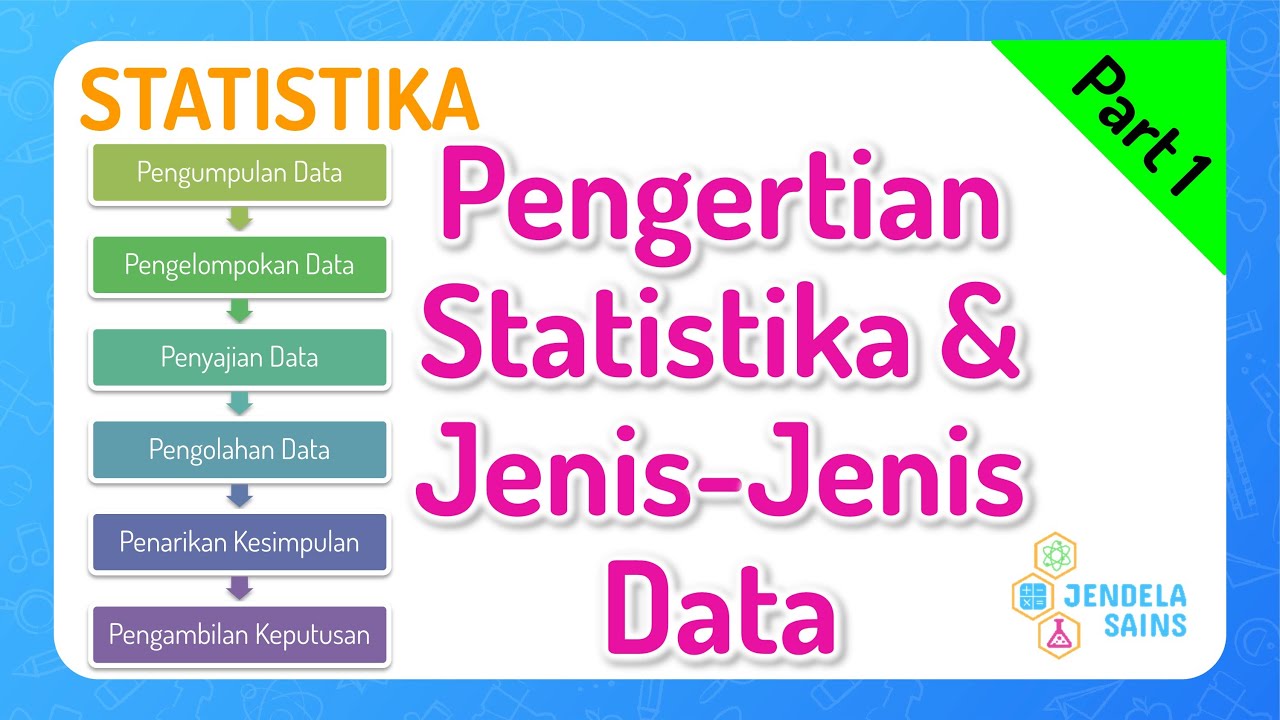
TLDRThis educational video explains the fundamentals of statistics, focusing on data collection and presentation. It covers key concepts such as population, sample, datum, primary vs. secondary data, and various data collection methods like interviews, questionnaires, and observations. The video also explores the importance of organizing and presenting data through tables (e.g., frequency distribution tables) and diagrams (e.g., bar charts, line graphs, pie charts). With practical examples, it helps viewers understand how to work with and analyze data in a structured and insightful way.
Takeaways
- 😀 Data collection is the first step in any research, where raw data is gathered through methods like interviews, questionnaires, and observations.
- 😀 Population refers to the entire group being studied, and a sample is a smaller portion of that group, used to represent the whole.
- 😀 A datum is a single piece of data, while data refers to a collection of such individual data points.
- 😀 Primary data is obtained directly from the source, while secondary data is collected indirectly through intermediaries.
- 😀 Tables are an essential tool for presenting data and can be categorized into types like row-column tables, contingency tables, and frequency distribution tables.
- 😀 Frequency distribution tables organize data into intervals, showing how frequently certain values occur within those ranges.
- 😀 A frequency distribution table requires careful attention to ensure that the intervals are consistent and logical (e.g., 1-3, 4-6).
- 😀 Diagrams, such as bar charts, line graphs, and pie charts, are visual tools that help convey data in a clear and easily understandable format.
- 😀 Bar charts are useful for comparing different categories of data, while line graphs are ideal for showing trends over time.
- 😀 A pie chart is most effective when displaying proportions or parts of a whole.
- 😀 Data presentation involves giving a title, listing the data categories, and ensuring the correct labeling and format for clarity and ease of understanding.
Q & A
What are the main areas of statistical analysis covered in the video?
-The main areas of statistical analysis covered include data collection, data presentation, data measurement, data interpretation, and drawing conclusions, with a focus on data presentation in this particular session.
Why is data collection important in research?
-Data collection is essential because it provides the raw material or 'ingredients' needed for analysis. Without data, drawing any conclusions or performing research is not possible.
What is the difference between 'populasi' (population) and 'sampel' (sample) in statistics?
-In statistics, 'populasi' refers to the entire set of objects or data that share a common characteristic, while 'sampel' refers to a subset of the population, chosen to represent the whole.
Can you provide an example of how data from different categories should not be mixed?
-For instance, you should not mix data on the prices of staple goods (sembako) with data on skincare products, as they belong to different categories and would not lead to meaningful conclusions if combined.
What is a 'datum' in statistical terms?
-A 'datum' is a single piece of information or a specific data point. It is part of a larger data set and is related to the overall data being analyzed.
How do 'primary' and 'secondary' data differ?
-Primary data is collected directly from the source, such as asking a teacher for student scores. Secondary data is obtained indirectly, like asking students about their scores, which they may not have directly from the teacher.
What are some methods for collecting data?
-Methods for data collection include interviews (wawancara), questionnaires (kuesioner), and observations (pengamatan), each of which has its specific use depending on the nature of the study.
What is a frequency distribution table and how is it used?
-A frequency distribution table organizes data into intervals and shows how many times each interval occurs. It is commonly used to summarize large sets of data and find patterns.
Why is it important to keep the intervals consistent in a frequency distribution table?
-It is crucial to maintain consistent intervals in a frequency distribution table to ensure that the data is organized in a meaningful and comparable way, allowing for accurate analysis.
What are the types of diagrams mentioned in the video for presenting data?
-The video mentions three types of diagrams for presenting data: bar diagrams, line diagrams, and pie charts (circle diagrams). These visual tools help represent data clearly and effectively.
Outlines

此内容仅限付费用户访问。 请升级后访问。
立即升级Mindmap

此内容仅限付费用户访问。 请升级后访问。
立即升级Keywords

此内容仅限付费用户访问。 请升级后访问。
立即升级Highlights

此内容仅限付费用户访问。 请升级后访问。
立即升级Transcripts

此内容仅限付费用户访问。 请升级后访问。
立即升级浏览更多相关视频

Statistika 1 - Penyajian Data Tunggal Matematika SMA / MA / SMK

Statistika • Part 2: Metode Pengumpulan Data dan Pengelompokan Data Tunggal
Statistika Matematika Kelas 12 • Part 1: Pengertian Statistika dan Jenis-Jenis Data
KONSEP DASAR STATISTIKA DAN DISTRIBUSI FREKUENSI

Konsep Dasar Statistik Pendidikan

Pendahuluan Metode Penelitian Part I
5.0 / 5 (0 votes)
