Relasi dan Fungsi Matematika Kelas 10 • Part 12: Fungsi Sepotong-Sepotong / Piecewise Function
Summary
TLDRThis video provides an in-depth explanation of piecewise functions, illustrating how to graph them and determine their domain and range. Through clear examples, viewers learn how different rules apply to specific segments of the domain, including the concepts of absolute value, linear functions, quadratic functions, and constant functions. The script takes viewers step-by-step through the process of plotting graphs and understanding the behavior of piecewise functions. By the end, learners gain a comprehensive understanding of how to work with and visualize these functions, making it an essential resource for students in introductory mathematics courses.
Takeaways
- 😀 Piecewise functions have multiple rules, each applying to specific sections of the domain.
- 😀 An example of a piecewise function is f(x) = x - 1 for x ≤ 0, and f(x) = 2 - x for x > 0.
- 😀 When graphing piecewise functions, you need to plot each part separately based on the rules defined for their respective domains.
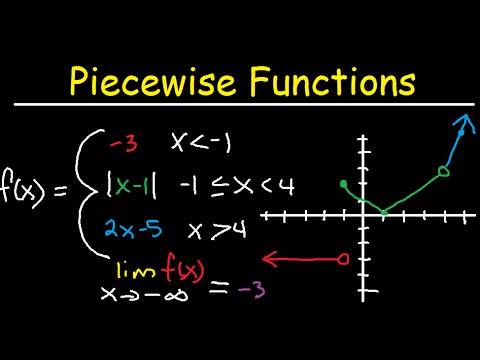
- 😀 Absolute value functions can also be considered piecewise functions, where f(x) = |x| is defined as f(x) = x for x ≥ 0, and f(x) = -x for x < 0.
- 😀 Graphing involves using open and closed circles to denote whether the endpoints are included in the domain.
- 😀 For the function f(x) = x - 1 (when x ≤ 0), the graph is a straight line with a closed circle at x = 0.
- 😀 For the function f(x) = 2 - x (when x > 0), the graph is a line with an open circle at x = 0 and a decreasing slope.
- 😀 When analyzing the range of piecewise functions, it's important to observe how the graph behaves at each section of the domain.
- 😀 The range of f(x) = x - 1 (x ≤ 0) is all values less than or equal to -1, while the range of f(x) = 2 - x (x > 0) is less than 2.
- 😀 In piecewise functions with overlapping rules, pay attention to whether the endpoints are included in the range by checking whether the function at the boundary is defined with an open or closed circle.
Q & A
What is a piecewise function?
-A piecewise function is a function that is defined by multiple different rules or formulas, each of which applies to a specific interval or part of the domain.
How do we represent piecewise functions graphically?
-Piecewise functions are represented graphically by drawing separate segments or parts of the function’s graph according to the different rules, and the domain for each segment must be clearly defined.
Can you give an example of a piecewise function?
-Sure! For example, the function f(x) = x - 1 if x ≤ 0 and f(x) = 2 - x if x > 0. The graph of this function consists of two separate line segments, one for x ≤ 0 and another for x > 0.
What does it mean when a graph point is 'closed' versus 'open' in a piecewise function?
-A 'closed' point means that the function includes the value at that point (solid dot), while an 'open' point indicates that the value is not included at that point (hollow dot).
In the example, how is the function f(x) = x - 1 for x ≤ 0 graphed?
-The function f(x) = x - 1 is a linear function, which is graphed as a straight line. For x ≤ 0, the graph starts at x = 0 and extends to the left, with the point (0, -1) being included.
What is the range of the piecewise function f(x) = x - 1 if x ≤ 0 and f(x) = 2 - x if x > 0?
-The range of this function is all y-values less than 2. As x approaches negative infinity, y decreases without bound, and the maximum value of y is 2 (not included).
How do we handle the domain when graphing piecewise functions?
-When graphing piecewise functions, it is important to respect the domain restrictions for each part of the function, ensuring that each rule applies only to the specific interval of x-values as indicated.
What does the absolute value function look like in a piecewise form?
-The absolute value function, written as f(x) = |x|, is a piecewise function that is f(x) = x if x ≥ 0 and f(x) = -x if x < 0. Its graph forms a 'V' shape, with the vertex at the origin.
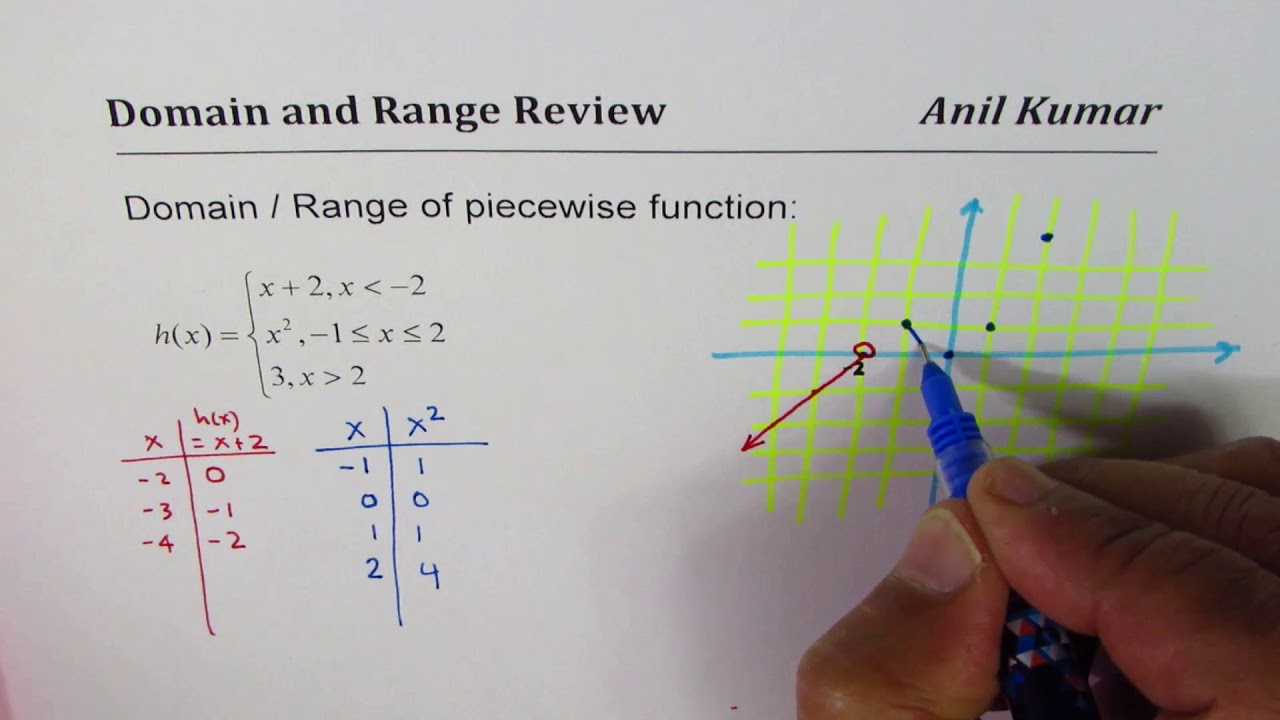
How do you determine the domain and range of a piecewise function?
-To determine the domain, check the x-values over which each part of the function is defined. To find the range, look at the output values (y-values) for each segment of the function and combine them.
What is the significance of the notation 'y = 2' in the piecewise function example?
-In the example where f(x) = 2 for x > 1, this represents a constant function. The graph is a horizontal line at y = 2, extending from x = 1 to positive infinity.
Outlines

此内容仅限付费用户访问。 请升级后访问。
立即升级Mindmap

此内容仅限付费用户访问。 请升级后访问。
立即升级Keywords

此内容仅限付费用户访问。 请升级后访问。
立即升级Highlights

此内容仅限付费用户访问。 请升级后访问。
立即升级Transcripts

此内容仅限付费用户访问。 请升级后访问。
立即升级浏览更多相关视频
Graphing Piecewise Functions, Domain & Range - Limits, Continuity, & Absolute Value ,
Piecewise Function Domain Range Quadratic Linear Constant

Domain & Range dari Grafik Fungsi #fazanugas

#4 Grafik & Fungsi | KALKULUS

Functions and Graphs | Precalculus
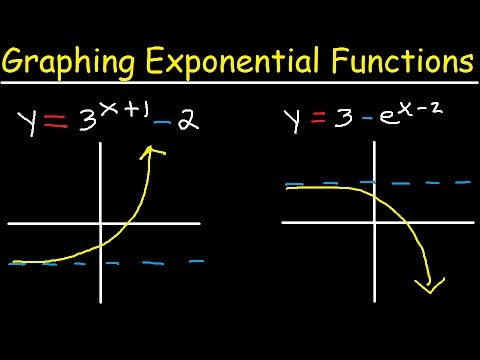
Graphing Exponential Functions With e, Transformations, Domain and Range, Asymptotes, Precalculus
5.0 / 5 (0 votes)
