Belajar Statistika SMP - Pengantar
Summary
TLDRIn this educational video, the presenter introduces the topic of statistics, focusing on data processing methods, including measures of central tendency and data spread. The video begins with a brief refresher on the basics of statistics, explaining how data is collected through interviews, surveys, observations, or document studies. It emphasizes the importance of presenting data in clear formats, such as tables or various types of diagrams. The video concludes with an invitation for viewers to engage further through comments or social media, with a promise of more in-depth lessons on data analysis in future videos.
Takeaways
- 😀 Introduction to the video and greeting viewers in a friendly manner.
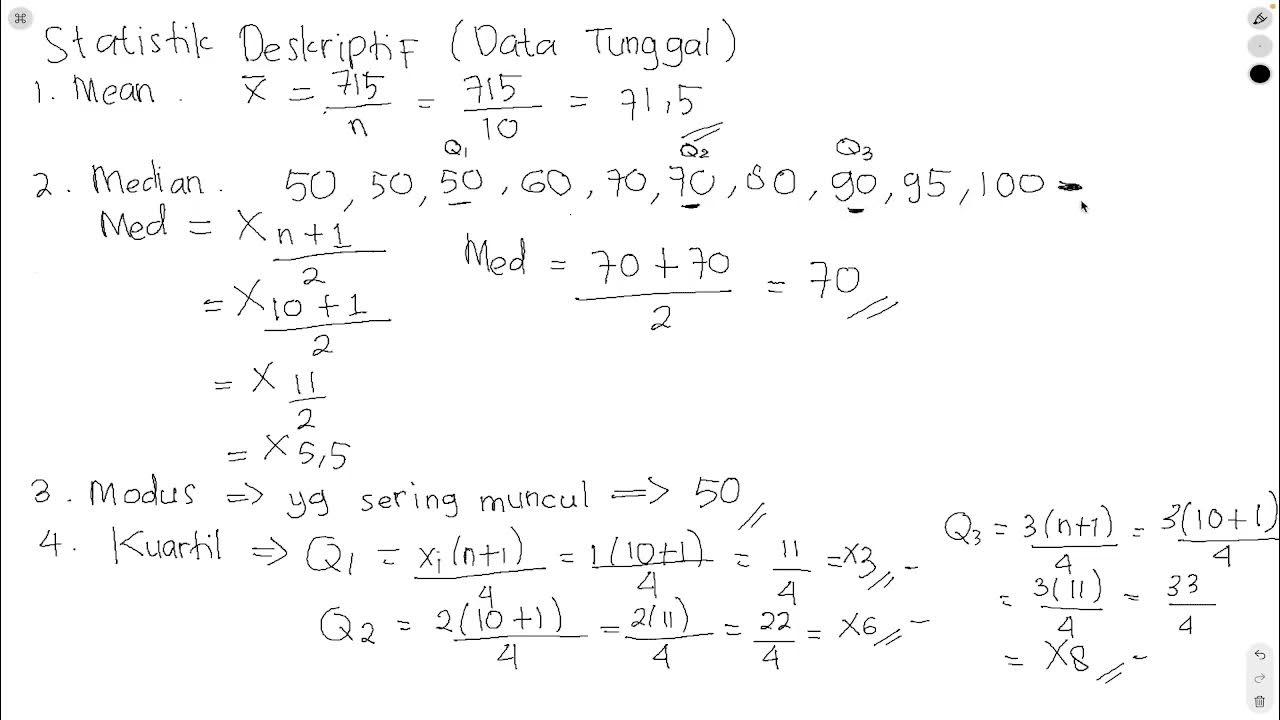
- 😀 The video aims to teach about statistics, specifically focusing on data centralization and dispersion.
- 😀 Explanation of what statistics is: the collection, presentation, processing, analysis, and conclusion of data.
- 😀 Data can be collected through interviews, surveys, observations, and document studies.
- 😀 Once data is collected, it is important to present it in a visual or mathematical format for easier understanding.
- 😀 Methods of presenting data include tables, bar charts, pie charts, line graphs, and other diagram types.
- 😀 The video will focus on processing data related to centralization and dispersion in upcoming lessons.
- 😀 The importance of presenting data in a clear and accessible way to aid understanding.
- 😀 The speaker invites viewers to engage with the content by commenting, emailing, or reaching out via social media.
- 😀 The speaker closes the video with a warm farewell and an Islamic greeting, inviting viewers to stay tuned for future lessons.
Q & A
What is the main focus of the video?
-The video focuses on teaching about statistical data processing, specifically the concepts of data centralization and data dispersion.
What are the key components of statistics as mentioned in the script?
-The key components of statistics include data collection, data presentation, data processing and analysis, and drawing conclusions.
What are some methods for collecting data?
-Data can be collected through interviews, surveys, observations, and document studies.
Why is it important to present data in a different form?
-Presenting data in different forms helps readers understand it more easily and makes it more accessible for analysis.
What are some ways data can be presented?
-Data can be presented in tables or various types of diagrams, such as bar charts, pie charts, and line graphs.
What is the next topic that will be discussed in the video series?
-The next topic to be discussed will be data processing, focusing on data centralization and data dispersion.
Why should viewers keep watching the video series?
-Viewers should keep watching to learn more about data processing methods, including centralization and dispersion techniques, which will be covered in upcoming videos.
How can viewers engage with the content?
-Viewers can engage by commenting on the video, sending feedback via email, or reaching out through social media.
What is the goal of the video series?
-The goal of the video series is to help viewers learn and understand statistical concepts related to data processing, particularly focusing on centralization and dispersion.
What is the final message the presenter shares in the video?
-The presenter thanks the viewers for their attention and encourages them to continue watching the series, offering an invitation to engage with comments and suggestions.
Outlines

此内容仅限付费用户访问。 请升级后访问。
立即升级Mindmap

此内容仅限付费用户访问。 请升级后访问。
立即升级Keywords

此内容仅限付费用户访问。 请升级后访问。
立即升级Highlights

此内容仅限付费用户访问。 请升级后访问。
立即升级Transcripts

此内容仅限付费用户访问。 请升级后访问。
立即升级


5.0 / 5 (0 votes)
