STATISTIKA (MEAN,MEDIAN,MODUS DAN STATISTK LIMA SERANGKAI)
Summary
TLDRThis video provides an engaging and detailed introduction to descriptive statistics, focusing on key concepts like data presentation, population vs. sample, and measures of central tendency (mean, median, mode). The instructor explains the importance of organizing and summarizing data through various methods such as bar graphs, line charts, and pie charts. Real-world examples illustrate these concepts, such as calculating the five-number summary (maximum, minimum, quartiles, and median). The video is designed to make statistical methods accessible and practical for students, offering clear explanations and helpful examples to deepen understanding.
Takeaways
- 😀 Descriptive statistics helps to collect, organize, and present data in a way that's easy to understand.
- 😀 Statistics is a branch of applied mathematics focused on methods for collecting and grouping data.
- 😀 Descriptive statistics involves presenting data in clear forms, such as graphs and tables, to make it more digestible.
- 😀 Inferential statistics involves drawing conclusions and making predictions based on data.
- 😀 Populations refer to all the items or individuals of interest, while samples are subsets taken from a population.
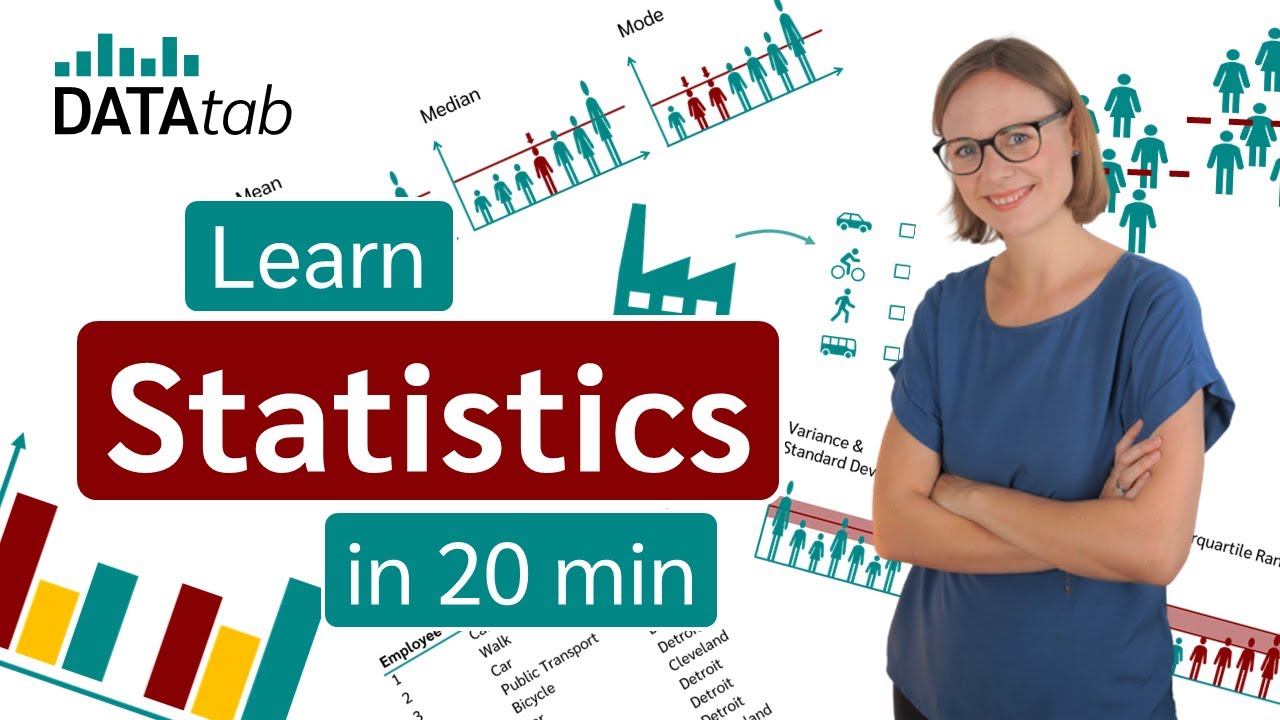
- 😀 The mean (average), median (middle value), and mode (most frequent value) are key measures of central tendency in statistics.
- 😀 The median is calculated by finding the middle value in a dataset, with special rules for odd and even data points.
- 😀 The mode is the value that appears most frequently in a dataset.
- 😀 A 'five-number summary' in statistics includes the maximum, minimum, and the three quartiles (Q1, Q2, Q3).
- 😀 Quartiles divide a dataset into four equal parts and help in analyzing the distribution of the data.
- 😀 Understanding and calculating quartiles, median, and the five-number summary is essential in descriptive statistics.
Q & A
What is the primary focus of statistics as discussed in the script?
-The primary focus of statistics, as discussed in the script, is on methods for collecting, organizing, grouping, and presenting data in an understandable format.
What are the two main branches of statistics mentioned in the script?
-The two main branches of statistics mentioned are Descriptive Statistics and Inferential Statistics.
What is Descriptive Statistics and what does it involve?
-Descriptive Statistics involves activities such as collecting, grouping, organizing, and presenting data in a clear and easily understandable format. It focuses on summarizing data.
What is the role of Inferential Statistics?
-Inferential Statistics involves making conclusions, predictions, or inferences about a population based on a sample of data.
How is data presented in Descriptive Statistics?
-Data in Descriptive Statistics can be presented through various methods such as bar charts, line graphs, pie charts, pictograms, cartograms, and scatter plots.
What is the difference between population and sample?
-A population refers to the entire set of data or subjects being studied, while a sample is a smaller, representative subset of that population chosen for analysis.
What are measures of central tendency, and what are some examples?
-Measures of central tendency include mean (average), median (middle value), and mode (most frequent value), which summarize a set of data by identifying a central value.
How is the mean (average) calculated?
-The mean is calculated by summing all the data values and dividing by the total number of data points.
What is the median, and how do you calculate it?
-The median is the middle value of a dataset when ordered from smallest to largest. If the dataset has an odd number of values, the middle value is the median; if even, the median is the average of the two middle values.
How is the mode defined and how is it found?
-The mode is the value that occurs most frequently in a dataset. It is identified by finding the number that appears the most often.
What is the 5-number summary, and what does it include?
-The 5-number summary includes the minimum value, maximum value, the first quartile (Q1), the median (Q2), and the third quartile (Q3), which are used to summarize a dataset.
How do you calculate quartiles, and what do they represent?
-Quartiles divide a dataset into four equal parts. The first quartile (Q1) is the median of the lower half, the second quartile (Q2) is the median of the entire dataset, and the third quartile (Q3) is the median of the upper half.
Outlines

此内容仅限付费用户访问。 请升级后访问。
立即升级Mindmap

此内容仅限付费用户访问。 请升级后访问。
立即升级Keywords

此内容仅限付费用户访问。 请升级后访问。
立即升级Highlights

此内容仅限付费用户访问。 请升级后访问。
立即升级Transcripts

此内容仅限付费用户访问。 请升级后访问。
立即升级浏览更多相关视频
What is Statistics? A Beginner's Guide to Statistics (Data Analytics)!

KUPAS TUNTAS: Apakah Perbedaan Statistik Inferensial dengan Statistik Deskriptif ?

KUPAS TUNTAS: Apakah Perbedaan Statistik Inferensial dengan Statistik Deskriptif ?
KONSEP DASAR STATISTIKA DAN DISTRIBUSI FREKUENSI

Statistika dan Probabilitas

[1] Penyajian Data (Tabel)
5.0 / 5 (0 votes)
