Statistika dan Probabilitas
Summary
TLDRThe lecture provides a comprehensive introduction to descriptive statistics and hypothesis testing. It explains the key methods in statistics, including data collection, classification, and analysis, using tools like SPSS and Excel. The discussion also covers the relationship between statistics and other fields such as economics, psychology, and engineering. Key concepts such as population, sample, variables, and the difference between continuous and discrete data are explored. The session emphasizes the importance of statistical analysis in decision-making and forecasting, offering practical insights for students in various academic disciplines.
Takeaways
- 😀 Statistics is used for data analysis, forecasting, and hypothesis testing across various fields such as business, economics, and social sciences.
- 😀 Hypothesis testing helps determine if an assumption, such as students preferring certain subjects, is valid by analyzing collected data and comparing the test statistic (T-value) with a critical value.
- 😀 Data types include qualitative (non-numeric) and quantitative (numeric) data. Quantitative data can be further classified into continuous and discrete variables.
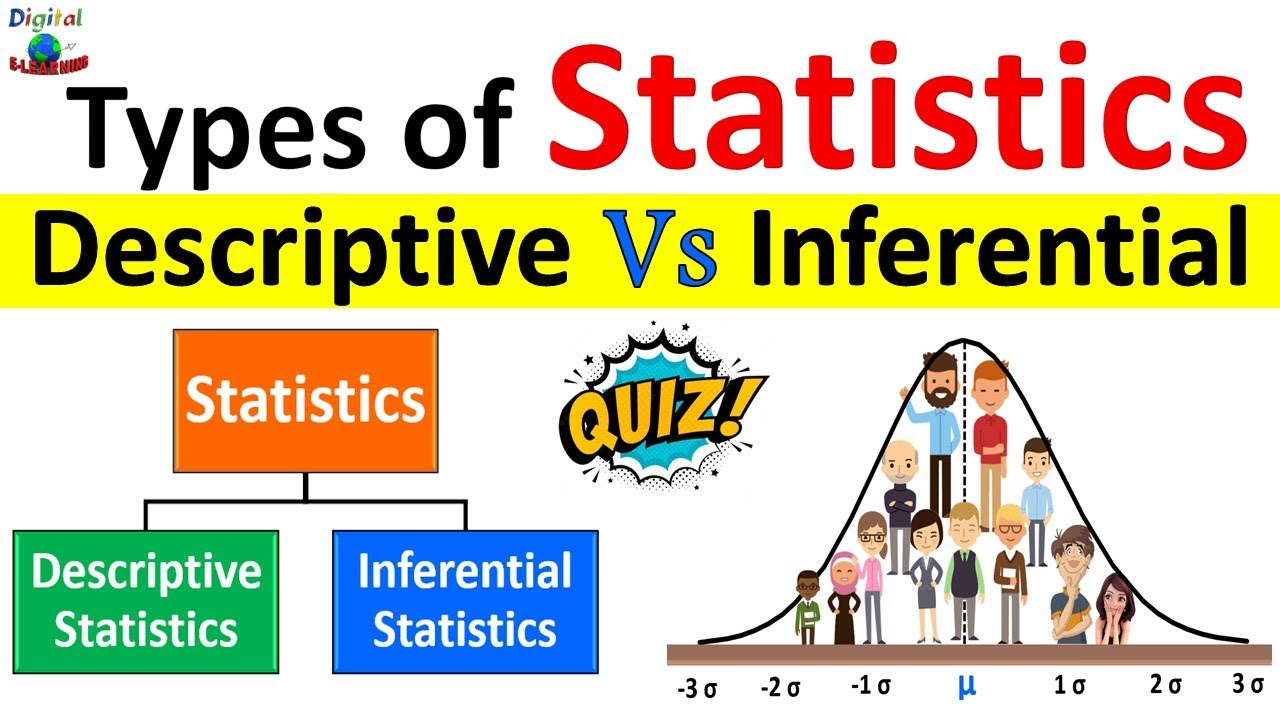
- 😀 Descriptive statistics summarizes and describes data, while inferential statistics is used to make predictions or generalizations about a population based on a sample.
- 😀 Data collection methods include primary data (directly collected from respondents) and secondary data (collected from existing sources like company reports).
- 😀 Statistical analysis involves several steps: identifying the research problem, collecting data, classifying data, processing it with software, and presenting the results.
- 😀 Software tools like Microsoft Excel, SPSS, Minitab, and Stata are essential for processing and analyzing statistical data.
- 😀 Understanding the relationship between variables and using statistical methods can help make informed decisions and predictions, improving decision-making processes.
- 😀 Variables in research can be continuous (e.g., height) or discrete (e.g., number of children), each having different implications for data analysis.
- 😀 Different data approaches include descriptive statistics, inferential statistics, and combined methods, each serving different purposes in research and data analysis.
- 😀 The process of analyzing data using statistics is applicable to various fields, helping professionals make more accurate decisions, plan for the future, and test hypotheses.
Q & A
What is the primary purpose of statistics as discussed in the lecture?
-The primary purpose of statistics is to analyze data, perform forecasting, and conduct hypothesis testing to make informed decisions based on empirical evidence.
What is hypothesis testing in the context of statistics?
-Hypothesis testing involves evaluating a proposed hypothesis through statistical methods. The goal is to determine whether the data supports or rejects the hypothesis, often using tools like the t-test.
How is a t-test used in hypothesis testing?
-A t-test is used to compare the results of a sample to the expected results based on a hypothesis. It involves comparing the t-value obtained from data to a critical value from the t-distribution table to decide if the hypothesis can be accepted or rejected.
What types of data can be used in statistical tests?
-Data can be either qualitative (e.g., nominal or ordinal) or quantitative (e.g., interval or ratio). The choice of data type influences the statistical methods and software tools used.
What is the difference between continuous and discrete variables?
-Continuous variables can take any value within a range (e.g., height, weight), while discrete variables are countable and limited to specific values (e.g., the number of children in a family).
What is the relationship between probability theory and statistics?
-Probability theory is closely related to statistics as it provides a framework for calculating the likelihood of events, which can be used to make predictions and analyze outcomes in statistical tests.
What are some of the fields where statistics can be applied?
-Statistics can be applied in various fields including economics, business, engineering, social sciences, psychology, and natural sciences to support data-driven decision-making and research.
How does statistical analysis help in decision-making?
-Statistical analysis helps in decision-making by providing insights into relationships between variables and predicting outcomes, thus enabling better choices based on data-driven evidence.
What are the key steps involved in performing a statistical analysis?
-The key steps include identifying the problem, collecting data (either primary or secondary), classifying and processing the data, analyzing the results, and presenting findings to draw conclusions.
What is the significance of statistical software in data analysis?
-Statistical software like SPSS, Microsoft Excel, and others enable efficient processing and analysis of data, allowing researchers to apply various statistical tests and produce reliable results quickly and accurately.
Outlines

This section is available to paid users only. Please upgrade to access this part.
Upgrade NowMindmap

This section is available to paid users only. Please upgrade to access this part.
Upgrade NowKeywords

This section is available to paid users only. Please upgrade to access this part.
Upgrade NowHighlights

This section is available to paid users only. Please upgrade to access this part.
Upgrade NowTranscripts

This section is available to paid users only. Please upgrade to access this part.
Upgrade NowBrowse More Related Video

Konsep Dasar Pengujian Hipotesis

What is Statistics? A Beginner's Guide to Statistics (Data Analytics)!

Descriptive Statistics vs Inferential Statistics | Measure of Central Tendency | Types of Statistics

Intro to Hypothesis Testing in Statistics - Hypothesis Testing Statistics Problems & Examples

Pengujian Hipotesis Deskriptif Satu Sampel

Apa itu Statistika?
5.0 / 5 (0 votes)