‼️PENGENALAN SPSS | JENIS DATA & CONTOH KASUS DASAR - Part2
Summary
TLDRThis video serves as an introduction to SPSS, a popular statistical software, aimed at both practitioners and students. The presenter covers basic concepts such as the SPSS interface, including the Data View and Variable View, and explains key features like data management, file handling, and the transformation of variables. The video walks viewers through setting up a dataset, including data types (qualitative vs quantitative) and their corresponding scales (nominal, ordinal, interval, ratio). Additionally, the tutorial demonstrates a simple example of data input and analysis, showcasing how to use SPSS for frequency analysis. The session concludes with guidance for continuing with more complex analyses in future lessons.
Takeaways
- 😀 SPSS (Statistical Package for the Social Sciences) is a popular statistical software used by professionals and students for data analysis and research tasks.
- 😀 The SPSS interface consists of two main views: Data View (similar to Excel) and Variable View, where users can set up variables for analysis.
- 😀 In SPSS, there are several menus including File, Edit, View, Data, Transform, Analyze, and Graphs, each serving a distinct function for managing, manipulating, and analyzing data.
- 😀 To analyze data in SPSS, users must first define the types of variables (qualitative or quantitative) and their appropriate data scales (nominal, ordinal, interval, or ratio).
- 😀 Data in SPSS can be either qualitative (categorical) or quantitative (numerical). Qualitative data requires transformation into numerical form for statistical processing.
- 😀 Qualitative data types include Nominal (e.g., job types or gender) and Ordinal (e.g., satisfaction levels). Quantitative data includes Interval (e.g., temperature) and Ratio (e.g., height, weight).
- 😀 SPSS helps transform qualitative data (e.g., gender) into numerical values for statistical analysis, allowing data such as '1' for female and '2' for male.
- 😀 The data preparation in SPSS involves setting up the variable names, types, and categories (e.g., setting gender as 1 for female, 2 for male), before inputting the actual data values.
- 😀 After inputting data, SPSS allows users to perform descriptive analysis, such as calculating frequencies and percentages for categorical variables like gender.
- 😀 The tutorial includes a practical example of using SPSS to input and analyze data, demonstrating how to calculate and interpret basic statistics like gender distribution.
- 😀 The video concludes with an invitation to continue exploring more advanced features and examples in SPSS, with a focus on more complex datasets and statistical methods.
Q & A
What is SPSS and what is it used for?
-SPSS (Statistical Package for the Social Sciences) is a statistical software application used for data analysis. It is commonly used by practitioners for statistical analysis and by students for research, particularly in preparing and analyzing data for research projects.
What are the two main views in SPSS and what do they do?
-SPSS has two main views: Data View and Variable View. Data View allows users to input and view the data in rows and columns, similar to a spreadsheet. Variable View is where users define and set up variables for data analysis, specifying characteristics like data type, labels, and measurement scales.
How does SPSS handle data input and variable definition?
-In SPSS, users input data in the Data View, while in the Variable View, users define variables. They can set the data type (e.g., numeric, string), assign labels (e.g., 1 for female, 2 for male), and determine properties like the width of columns, decimal places, and measurement scales (nominal, ordinal, etc.).
What are the main types of data that SPSS can process?
-SPSS processes both qualitative and quantitative data. Qualitative data can be further classified as nominal (e.g., categories without an order) and ordinal (e.g., categories with an order). Quantitative data is divided into interval (e.g., temperature) and ratio data (e.g., height, weight), both of which involve numerical measurements.
What is the difference between nominal and ordinal data in SPSS?
-Nominal data represents categories without any particular order (e.g., gender or occupation). Ordinal data represents categories with a meaningful order, but the differences between categories are not necessarily consistent (e.g., satisfaction levels like 'very satisfied', 'satisfied').
How does SPSS handle missing data?
-In SPSS, missing data can be identified using the 'Missing' field in Variable View. Users can choose how missing data should be handled, whether it is excluded from analysis or imputed based on other data points.
What is the process for conducting a frequency analysis in SPSS?
-To perform a frequency analysis in SPSS, go to the 'Analyze' menu, select 'Descriptive Statistics', and then choose 'Frequencies'. You can then select the variable (e.g., gender) and SPSS will generate a frequency table showing the count and percentage for each category (e.g., number of males and females).
Why is it important to understand data types before inputting data into SPSS?
-Understanding the data types before inputting data into SPSS ensures that the data is entered correctly, which allows for proper analysis. For instance, qualitative data needs to be converted into numerical codes for SPSS to process it, while quantitative data should be entered as numbers for statistical analysis.
What is the purpose of using labels in SPSS?
-Labels in SPSS are used to provide meaningful names for data values, such as converting numerical codes (1 for female, 2 for male) into descriptive labels (e.g., 'Female', 'Male'). This helps make the data easier to understand and interpret during analysis.
How can users ensure their data is correctly formatted in SPSS?
-Users can ensure data is correctly formatted in SPSS by checking the Variable View, where they can define the correct data type (e.g., string, numeric), set the appropriate measurement scale (e.g., nominal, ordinal), and adjust settings like decimal places and column width to match the data format.
Outlines

此内容仅限付费用户访问。 请升级后访问。
立即升级Mindmap

此内容仅限付费用户访问。 请升级后访问。
立即升级Keywords

此内容仅限付费用户访问。 请升级后访问。
立即升级Highlights

此内容仅限付费用户访问。 请升级后访问。
立即升级Transcripts

此内容仅限付费用户访问。 请升级后访问。
立即升级浏览更多相关视频
Introduction to JASP: Discover Statistics with JASP for Beginners (1 of 6)

Introduction to the SPSS 27 Workspace for Beginners (with Puppies) (2 of 8)

Pertemuan 9_Statistika Ekonomi dan Bisnis

Sosyal Bilimlerde Araştırma Yöntemleri: 01 Giriş

Cara Uji Normalitas dan Homogenitas Menggunakan SPSS dengan Mudah
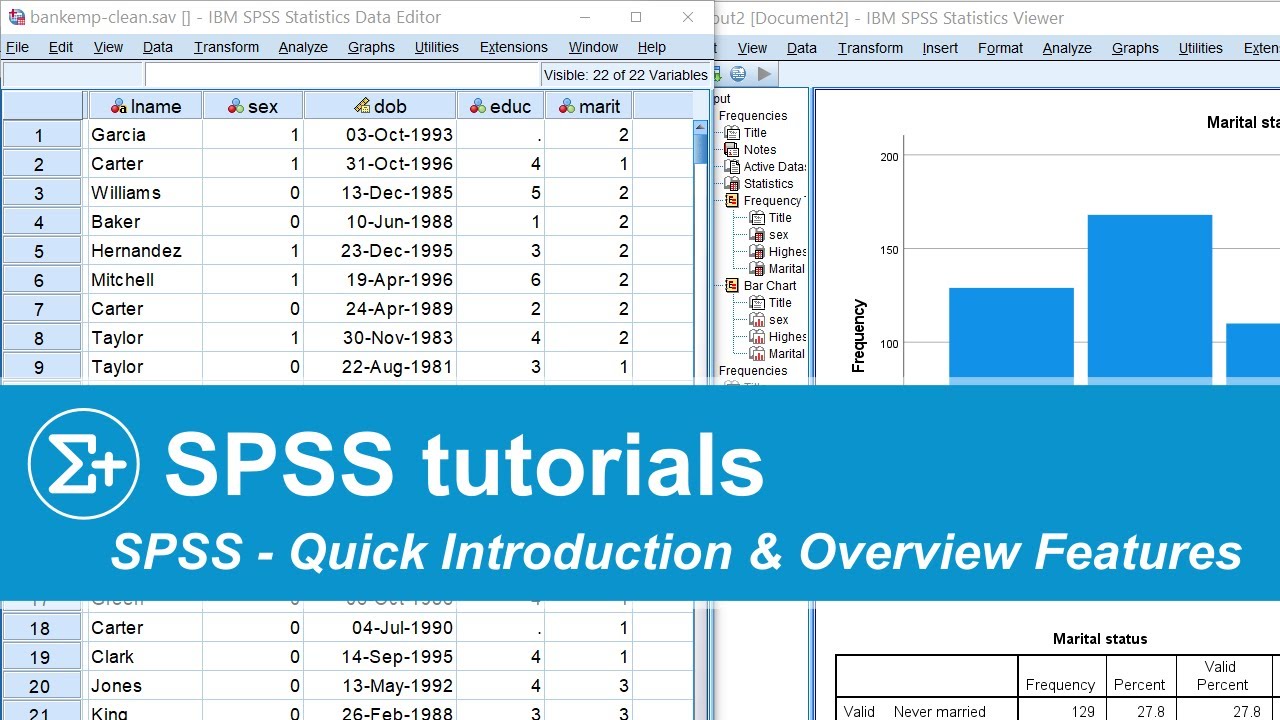
SPSS - Quick Introduction & Overview Main Features
5.0 / 5 (0 votes)
