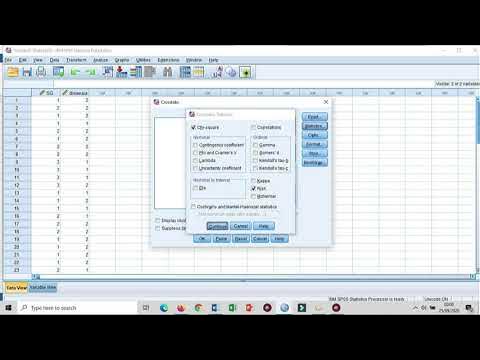
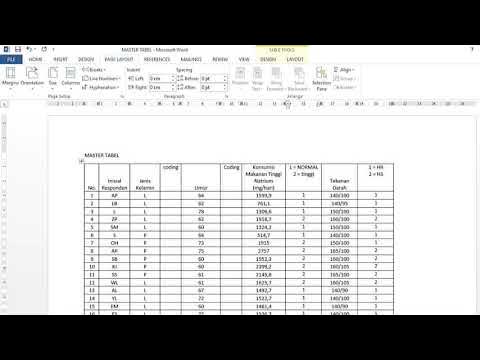
MATERI UJI CHI SQUARE DAN FISHER EXACT (UJI BEDA PROPORSI)
Summary
TLDRThis video explains statistical testing methods, focusing on the Chi-Square test and Fisher's Exact Test. The speaker highlights their use in analyzing contingency tables, with a focus on meeting the necessary conditions for valid results. Emphasis is placed on correct coding of categorical variables, such as smoking status or health conditions, to avoid misinterpretations. The video covers the calculation of p-values, odds ratios, and confidence intervals to assess the strength of relationships between variables. It also addresses potential pitfalls in the analysis and offers guidance on when to apply Fisher's Exact Test, making it a valuable resource for health data analysis.
Takeaways
- 😀 The chi-square test is used to analyze categorical data and determine if there is a significant association between variables.
- 😀 Fisher's exact test is an alternative to the chi-square test when its assumptions (e.g., expected frequencies) are not met.
- 😀 Contingency tables, specifically 2x2 tables, are essential for both chi-square and Fisher's exact tests to display relationships between categorical variables.
- 😀 Proper coding of categorical variables is crucial for accurate analysis (e.g., smoking status as 0 for non-smokers and 1 for smokers).
- 😀 The chi-square test assumes that no expected cell frequency is below 5. If this assumption is violated, Fisher's exact test should be used instead.
- 😀 Fisher's exact test may require simplifying categories in the data if there are too many cells with low expected frequencies.
- 😀 Results from chi-square or Fisher’s tests are interpreted using the p-value, which tells us if the association is statistically significant.
- 😀 Confidence intervals (CI) help determine the strength and direction of the relationship between variables. If CI includes 1, there’s no significant relationship.
- 😀 A protective effect can be identified if the confidence interval is below 1, while a risk effect is indicated if it’s above 1.
- 😀 It’s important to ensure correct data entry and coding to avoid errors that may distort test results, such as mistaking a protective factor for a risk factor.
- 😀 If the sample size is small or the expected frequencies are low, statistical methods must be adjusted accordingly to maintain validity, such as using Fisher’s exact test after simplification.
Q & A
What is the chi-square test (ksweb), and how is it used in health data analysis?
-The chi-square test is a statistical method used to test the relationship between two categorical variables. In health data analysis, it is used to determine whether there is a significant association between factors like smoking and heart disease by comparing the observed frequencies in a contingency table with the expected frequencies.
What is a contingency table, and how is it used in the chi-square test?
-A contingency table is a table used to organize categorical data for analysis. In the chi-square test, a 2x2 contingency table is typically used to examine the relationship between two categorical variables. The table displays the frequencies of observations for each category combination, which is then analyzed to determine if there's a statistically significant association.
What are the requirements for using the chi-square test, particularly regarding the contingency table?
-For the chi-square test to be valid, the contingency table must have no cells with a frequency of zero, and the expected frequency in each cell should generally be at least 5. If these conditions are not met, the test may not produce reliable results.
What is Fisher's Exact Test, and when should it be used instead of the chi-square test?
-Fisher's Exact Test is a statistical method used when the chi-square test's assumptions, such as minimum expected frequencies, are violated, especially in cases with small sample sizes or cells with expected frequencies below 5. It is an alternative when the chi-square test cannot be applied.
What steps should be taken if a contingency table has more than 2x2 cells or small expected frequencies?
-If a contingency table has more than 2x2 cells or small expected frequencies, the table should be simplified by combining categories to meet the requirements for statistical tests like chi-square or Fisher's Exact Test. This is necessary to ensure the validity of the test results.
Why is it important to code categorical variables correctly in data analysis?
-Correct coding of categorical variables is crucial for accurate analysis. If variables like smoking or heart disease are coded incorrectly (e.g., using the wrong numeric values for categories), it can lead to misleading results and potentially incorrect conclusions from statistical tests like chi-square or Fisher's Exact Test.
How should categorical variables be coded for a contingency table?
-Categorical variables should be coded using small numerical values, such as '0' for non-smokers and '1' for smokers. This coding ensures that the variables are represented correctly in the contingency table, preventing errors during analysis and ensuring accurate results.
What does the p-value tell us in the context of the chi-square test?
-The p-value in the chi-square test indicates whether there is a statistically significant association between the variables being tested. A p-value less than 0.05 typically suggests that there is a significant relationship between the variables, while a p-value greater than 0.05 indicates no significant association.
What is the role of confidence intervals (CI) in statistical analysis, and how are they interpreted?
-Confidence intervals (CI) provide a range of values within which the true parameter (e.g., odds ratio) is likely to fall. If the CI does not include 1, it indicates a significant relationship between the variables. If the CI includes 1, it suggests no significant association between the variables.
What is an odds ratio, and how does it relate to the chi-square test?
-An odds ratio is a measure of association that quantifies the strength of the relationship between two variables. In the chi-square test, it helps assess how strongly one variable influences the other, with values greater than 1 indicating a positive association and values less than 1 suggesting a protective effect.
Outlines

此内容仅限付费用户访问。 请升级后访问。
立即升级Mindmap

此内容仅限付费用户访问。 请升级后访问。
立即升级Keywords

此内容仅限付费用户访问。 请升级后访问。
立即升级Highlights

此内容仅限付费用户访问。 请升级后访问。
立即升级Transcripts

此内容仅限付费用户访问。 请升级后访问。
立即升级浏览更多相关视频

SYARAT MENGGUNAKAN UJI CHI SQUARE DAN FISHER EXACT

Understanding Chi-Square and Fisher's Exact Tests

mencari uji alternatif setelah uji chi square dengan tabel lebih dari 2x2 tidak memenuhi syarat

Uji Normalitas dan Homogenitas

*M* Uji Kecocokan: Frekuensi yang Diduga Sama dan yang Tidak Sama dengan Microsoft Excel dan SPSS

Uji Statistik Chi Square dengan tabel 2X2. cara membaca hasil uji chi square.
5.0 / 5 (0 votes)
