Representing an Inverse Function Through Table of Values, and Graph | General Mathematics
Summary
TLDRThis video lesson explains how to represent an inverse function using a table of values and a graph. The instructor demonstrates the process by starting with the one-to-one function f(x) = 2x + 1, deriving its inverse, and showing how to create a table of values for both the function and its inverse. The video highlights how the graphs of these functions are symmetric about the line y = x. The instructor concludes by summarizing the key concepts and encouraging viewers to ask questions in the comments section.
Takeaways
- 📊 The video is about representing inverse functions using tables of values and graphs.
- 🔢 The example used is a one-to-one function f(x) = 2x + 1, and the inverse is derived.
- 🔄 To find the inverse function, x and y are interchanged, resulting in y = (x - 1) / 2.
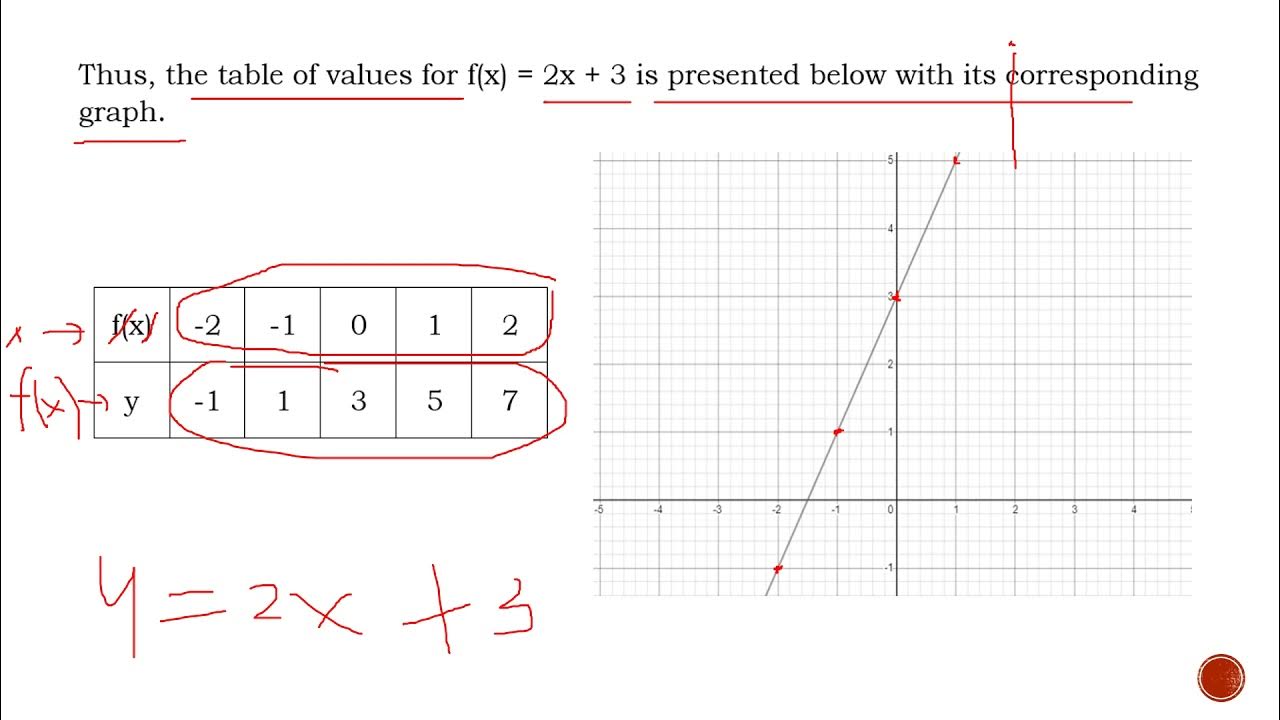
- ✏️ A table of values is created for both the original function and its inverse.
- 📉 The x-values for the table are: -2, -1, 0, 1, and 2. The corresponding y-values are calculated.
- 📈 The table shows the function's outputs: (-2, -3), (-1, -1), (0, 1), (1, 3), and (2, 5).
- 🖊 The inverse function's values are plotted similarly: (-3, -2), (-1, -1), (1, 0), (3, 1), and (5, 2).
- 🔍 The graph of the original function and its inverse are symmetrical around the line y = x.
- 🧮 The symmetry of the graphs demonstrates that the original function and inverse are reflections of each other.
- ✅ The video concludes with a review, encouraging viewers to leave questions in the comments if they have any.
Q & A
What is the main topic of the video?
-The main topic of the video is about representing an inverse function through a table of values and a graph.
What is the given one-to-one function in the example?
-The given one-to-one function in the example is f(x) = 2x + 1.
How is the inverse function found from the original function f(x) = 2x + 1?
-To find the inverse function, the variables x and y are interchanged, then solve for y. The resulting inverse function is f⁻¹(x) = (x - 1) / 2.
What values of x are used to create the table of values for the original function?
-The x values used to create the table of values for the original function are -2, -1, 0, 1, and 2.
How are the corresponding y values for the original function calculated?
-The corresponding y values are calculated by substituting each x value into the original function f(x) = 2x + 1. For example, for x = -2, f(x) = 2(-2) + 1 = -3.
What is the table of values for the inverse function based on the original function?
-The table of values for the inverse function is created by switching the roles of the x and y values from the original function. For example, if f(x) = -3 when x = -2, then for the inverse function f⁻¹(x), f⁻¹(-3) = -2.
What does the graph of the inverse function represent?
-The graph of the inverse function represents the reflection of the original function across the line y = x, showing the symmetry between the original and inverse functions.
How are the points for the original and inverse functions plotted on the Cartesian plane?
-The points for the original function are plotted by using the table of values for f(x), and the points for the inverse function are plotted using the corresponding table for f⁻¹(x). The two sets of points are reflected across the line y = x.
What do we notice about the relationship between the graphs of the original and inverse functions?
-The graphs of the original function and its inverse are symmetric with respect to the line y = x, meaning that they are mirror images of each other across this line.
What does it mean for the original function and inverse function to be symmetric with respect to y = x?
-Symmetry with respect to y = x means that every point (a, b) on the graph of the original function corresponds to a point (b, a) on the graph of the inverse function, and vice versa. This symmetry reflects the idea of swapping the roles of x and y in the functions.
Outlines

此内容仅限付费用户访问。 请升级后访问。
立即升级Mindmap

此内容仅限付费用户访问。 请升级后访问。
立即升级Keywords

此内容仅限付费用户访问。 请升级后访问。
立即升级Highlights

此内容仅限付费用户访问。 请升级后访问。
立即升级Transcripts

此内容仅限付费用户访问。 请升级后访问。
立即升级浏览更多相关视频
REPRESENTATIONS OF AN INVERSE FUNCTIONS | General Mathematics | Quarter 1 - Module 13

Graph & illustrates Linear Function Find the Domain Range Table of values Intercepts & Slope Math 8
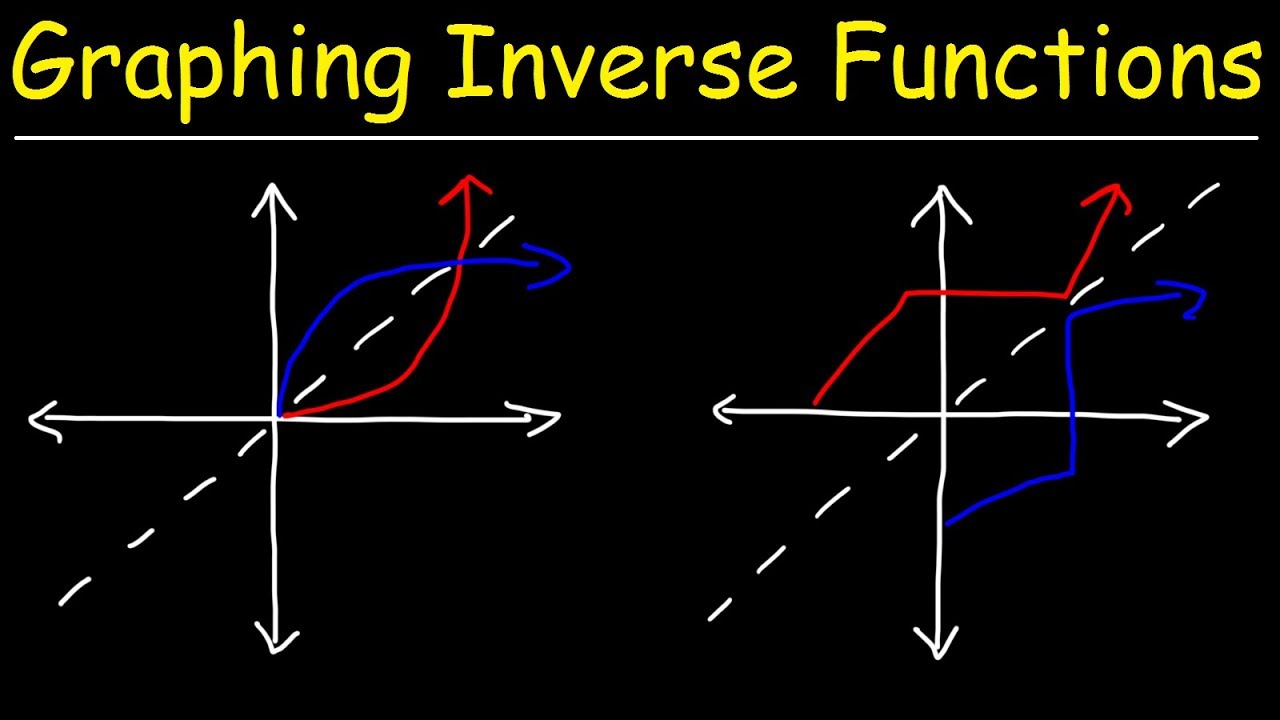
Graphing Inverse Functions
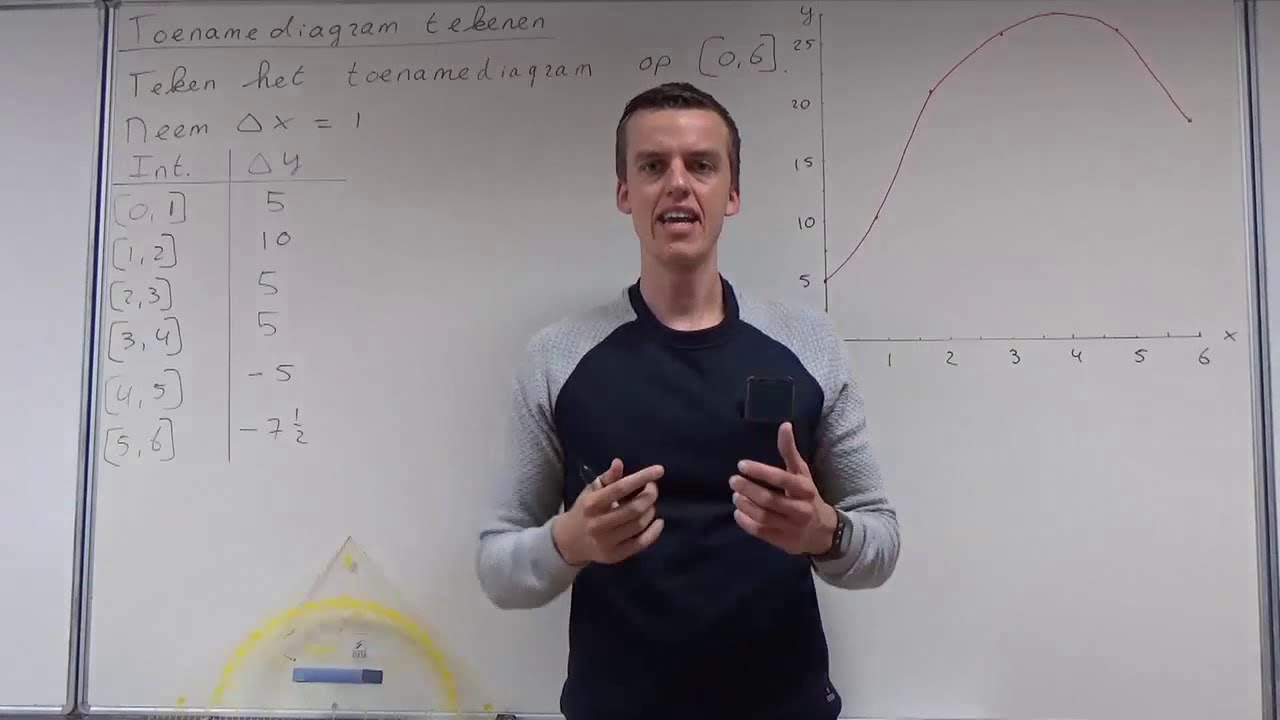
Toenamediagram tekenen bij een grafiek (HAVO wiskunde A/B & VWO wiskunde A)
3.1 Functions
Trigonometri Matematika Kelas 10 • Part 32: Menggambar Grafik Fungsi y=cos x dengan Lingkaran Satuan
5.0 / 5 (0 votes)
