RMIT University, Understanding the Business Environment, Assessment 3: Presentation

Andrew Hadiputra
13 Oct 202308:51

Summary

TLDRAndrew Hadra's presentation explores the economic impacts of taxes on consumer and producer welfare, focusing on consumption taxes and tariffs. He discusses how these taxes affect market equilibrium, leading to deadweight loss and reduced economic welfare. Andrew also touches on health taxes, suggesting that while they may initially decrease economic activity, they can boost long-term productivity and GDP by improving public health.

Takeaways

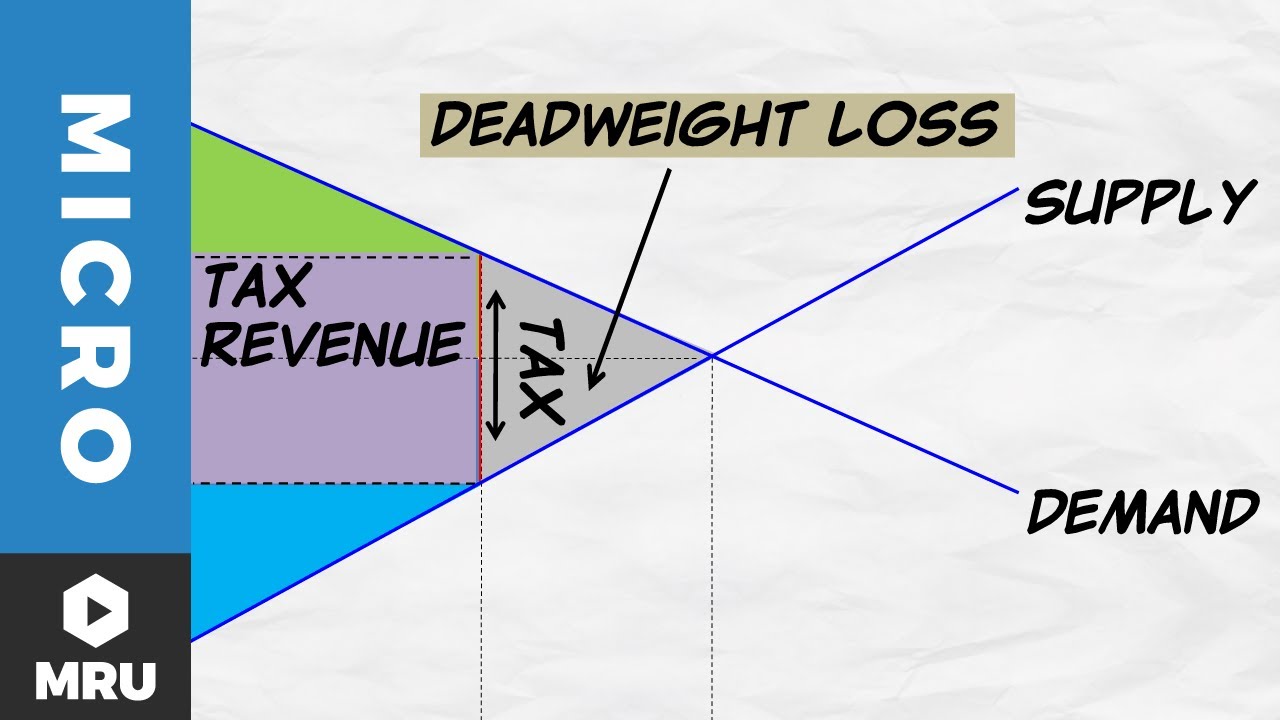
  • 📈 Consumer Surplus is the difference between what consumers are willing to pay and what they actually pay, represented by the blue triangle.
  • 🔶 Producer Surplus is the difference between the price a company receives and the price it is willing to sell at, represented by the orange triangle.
  • 💔 Consumption taxes, like sales tax, increase the cost of goods and services, leading to a decrease in consumer and producer surplus, shown as a rectangle.
  • 📉 The imposition of consumption taxes can cause a leftward shift in the supply curve (S), indicating a reduction in the supply of goods and services.
  • 🛒 An increase in consumer spending due to taxes can lead to a lower overall demand, affecting the economy negatively.
  • 📉 The welfare impact of consumption taxes is shown by the reduction in consumer and producer surplus, creating a deadweight loss represented by the orange triangle.
  • 🌐 Tariffs, as taxes on imports, protect domestic industries but can lead to inefficiencies and reduce welfare in the domestic economy.
  • 📊 The introduction of tariffs causes a shift in the equilibrium price, leading to a decrease in the quantity of imports and a deadweight loss between domestic supply and demand curves.
  • 💼 Macroeconomically, consumption taxes can lead to a decrease in aggregate demand, causing a leftward shift in the aggregate demand curve.
  • 🍏 Health taxes on harmful products can initially cause a leftward shift in the short-run aggregate supply curve due to increased production costs.
  • 🌿 In the long run, health taxes can improve public health, increasing workforce productivity and positively affecting the long-run aggregate supply curve.
  • 📊 Econometric models can be used to analyze the correlation between health taxes and economic growth, with health as the dependent variable and taxes as the independent variable.

Q & A

  • What is consumer surplus and how is it represented in a demand and supply diagram?

    -Consumer surplus is the difference between what consumers are willing to pay and what they actually pay. It is represented in a demand and supply diagram as the area of a triangle above the market price and below the demand curve, labeled in blue.

  • How does a consumption tax impact consumer surplus?

    -A consumption tax increases the cost of goods and services, leading to a higher market price. This results in a decrease in consumer surplus as consumers pay more for the same quantity of goods, represented by a movement along the demand curve without a shift.

  • What is producer surplus and where is it located in the diagram?

    -Producer surplus is the difference between the price a company receives and the price it is willing to accept. It is shown as the area of a triangle below the market price and above the supply curve, labeled in orange.

  • How does a consumption tax affect producer surplus?

    -A consumption tax can reduce producer surplus because it may lead to a decrease in the quantity of goods demanded, which in turn can lower the price received by producers due to the tax, causing a movement along the supply curve.

  • What is meant by deadweight loss in the context of consumption taxes?

    -Deadweight loss refers to the inefficiency and underproduction caused by taxes, represented by the area between the equilibrium levels before and after the tax imposition, labeled in orange. It signifies the net loss of both consumer and producer welfare due to the tax.

  • How does a tariff on imports affect the domestic market?

    -A tariff on imports raises the price for consumers and lowers the price received by producers, leading to a new equilibrium price that is higher than the free trade price. This causes domestic producers to supply more and consumers to demand less, reducing the quantity of imports.

  • What is the difference between the deadweight loss caused by a consumption tax and a tariff?

    -The deadweight loss caused by a consumption tax is represented by the area between the initial and new equilibrium levels, while the loss due to a tariff is the area between the domestic supply and demand curves, showing the loss of overall economic welfare due to the tariff.

  • How does a consumption tax on the macroeconomic level affect aggregate demand?

    -A consumption tax can lead to a decrease in consumer spending due to lower disposable income, which may cause a leftward shift in the aggregate demand curve, representing a reduction in overall demand in the economy.

  • What are the potential long-term economic benefits of a health tax on harmful products?

    -A health tax can improve public health by discouraging consumption of harmful products. This can increase workforce productivity and lifespans, positively affecting the long-run aggregate supply curve and potentially boosting real GDP and economic growth.

  • How can an econometric model help in understanding the impact of health taxes on economic growth?

    -An econometric model can be used to find correlations between health taxes (independent variable) and health outcomes or economic growth (dependent variable). It can help identify potential core founders and guide the analysis to understand the true effects of imposing such taxes.

  • What is the short-term impact of a health tax on aggregate demand?

    -In the short term, a health tax may lead to a leftward shift in the aggregate demand curve as consumers reduce their spending on unhealthy goods. However, if the tax improves public health, it could lead to increased consumer spending and a rightward shift in the long run.

Outlines

00:00

💼 Economic Impact of Consumption Taxes

The first paragraph discusses the concept of consumer and producer surplus in the context of a demand and supply diagram before taxes. It explains how consumption taxes increase the cost of goods and services for consumers, leading to a dead weight loss represented by the area between the demand and supply curves after the tax is applied. This tax reduces consumer and producer surplus, shifts the supply curve to the left, and decreases overall demand. The dead weight loss is described as the inefficiency and underproduction caused by taxes, which is a reduction in economic welfare.

05:01

🌡️ Health Taxes and Their Economic Implications

The second paragraph explores the effects of health taxes on economic growth. It begins by explaining how health taxes can initially reduce consumer spending and shift the aggregate demand curve to the left due to higher production costs for unhealthy goods. However, in the long term, if health taxes improve public health by reducing chronic diseases and increasing workforce productivity, they can positively affect the long run aggregate supply curve. The paragraph suggests that while health taxes might have a negative short-term impact on the economy, they can lead to increased productivity and economic growth in the long run. It also mentions the use of econometric models to analyze the correlation between health taxes and economic growth.

Mindmap

Keywords

💡Consumer Surplus

Consumer surplus refers to the difference between what consumers are willing to pay for a product and what they actually pay. In the context of the video, it is represented by the blue triangle in the demand and supply diagram before taxes. The script discusses how a consumption tax can reduce consumer surplus as it increases the price consumers pay, leading to a decrease in consumer welfare.

💡Producer Surplus

Producer surplus is the difference between the price at which producers are willing to sell a product and the price they actually receive. In the video, it is depicted by the orange triangle. The script explains that consumption taxes can reduce producer surplus because the taxes imposed on producers can lower the prices they receive, affecting their willingness to supply goods and services.

💡Dead Weight Loss

Dead weight loss is a measure of market inefficiency and underproduction caused by taxes or other market distortions. The script uses the term to describe the reduction in overall economic welfare due to consumption taxes. It is illustrated as the area between the equilibrium points before and after the tax, representing the loss of both consumer and producer welfare.

💡Consumption Tax

A consumption tax is a levy on the purchase of goods or services. The video script discusses the impact of consumption taxes on both microeconomic (individual consumer and producer behavior) and macroeconomic (aggregate demand and supply) levels. It explains how consumption taxes can lead to a decrease in consumer spending and a shift in the aggregate demand curve.

💡Tariff

A tariff is a tax imposed on imported goods, which the video script discusses as a means to protect domestic industries and generate government revenue. The script explains that tariffs can lead to a reduction in imports, an increase in domestic production, and a dead weight loss due to the inefficiency caused by the tax.

💡Free Trade

Free trade refers to the unrestricted movement of goods and services across national borders without barriers like tariffs or quotas. The video contrasts free trade with the scenario where tariffs are imposed, showing how tariffs alter the market equilibrium and lead to changes in domestic supply and demand.

💡Aggregate Demand

Aggregate demand is the total demand for all final goods and services in an economy at a given time. The script discusses how consumption taxes can lead to a decrease in consumer spending, which in turn can cause a leftward shift in the aggregate demand curve, indicating a reduction in overall demand.

💡Aggregate Supply

Aggregate supply represents the total supply of all final goods and services in an economy. The video script explains how a health tax on unhealthy products can initially cause a leftward shift in the short-run aggregate supply curve due to higher production costs, but potentially lead to a rightward shift in the long run if public health improves.

💡Health Tax

A health tax is a specific type of consumption tax imposed on products deemed harmful to health, such as sugary beverages or tobacco. The script argues that while health taxes may have short-term negative effects on consumer spending and aggregate demand, they can lead to long-term economic benefits by improving public health, increasing productivity, and boosting real GDP.

💡Econometric Model

An econometric model is a statistical tool used to estimate economic relationships among variables. The script suggests that an econometric model could be applied to analyze the correlation between health taxes and economic growth, identifying potential core factors that influence the relationship between taxes on unhealthy products and health outcomes.

Highlights

Consumer surplus is the difference between what consumers pay and what they would have been willing to pay.

Producer surplus is the difference between the price a company receives and the price it will be willing to sell.

Consumption taxes increase the cost of goods and services for consumers, leading to a reduction in consumer spending and supply.

Consumption taxes can cause a leftward shift in the supply curve, indicating reduced supply.

Consumer welfare decreases as the supply shifts upward due to consumption tax, leading to higher prices and decreased demand.

Producer welfare decreases as producers receive a lower price due to the imposed tax, reducing profits.

Deadweight loss is the market inefficiency and underproduction caused by taxes, representing a reduction in overall economic welfare.

Tariffs are taxes on imports that raise the price for consumers and lower the price received by producers.

Tariffs can lead to a decrease in imports and generate government revenue, but also cause a deadweight loss.

Tariffs protect domestic industries but can lead to inefficiencies and reduced welfare in the domestic economy.

A consumption tax implemented on the macroeconomic side raises the price of goods and services, potentially leading to a decrease in aggregate demand.

Health taxes imposed on harmful products like sugary beverages and tobacco can have long-term benefits for the economy.

Health taxes can initially cause a leftward shift in the short-run aggregate supply curve due to higher production costs.

Long-term impacts of health taxes on the long-run aggregate supply curve depend on the tax's influence on the economy's productive capacity.

A healthier workforce due to health taxes can lead to increased productivity and a rightward shift in the long-run aggregate supply curve.

Health taxes may reduce consumer spending on unhealthy goods in the short run, but improve public health outcomes in the long run.

Econometric models can be applied to find the correlation between health taxes and economic growth.

Fat taxes are imposed worldwide to control negative health outcomes by taxing unhealthy products.

Governments are aware that imposing fat taxes may decrease the economy in the short run but increase productivity and real GDP in the long run.

The true effect of imposing fat taxes can be discovered by considering the economy variable in econometric analysis.

Transcripts

play00:02

good morning Professor my name is Andrew

play00:04

hadra and today I'll be discussing about

play00:07

assessment Tre task

play00:08

one so there are five questions that are

play00:11

in the table of contents here and for

play00:13

the four questions I have drawn the

play00:14

diagram the graph and for the fifth

play00:16

question I have drawn the D diagram to

play00:18

discuss more about it for the first

play00:21

slide I'll be talking about the consumer

play00:22

and producer supplies that is happening

play00:25

in the equilibrium of a demand and

play00:26

Supply diagram before taxes so consumer

play00:29

suppli is the difference between what

play00:31

consumers pay and what they would have

play00:32

been willing to pay and it's labeled in

play00:34

the blue triangle and the produ Surplus

play00:36

is the difference between the price a

play00:38

company receives and the price it will

play00:40

be willing to sell which is labeled in

play00:42

the orange

play00:43

triangle so now I'll be talking about

play00:45

the consumption taxes and Welfare impact

play00:47

that is imposed in the economy so this

play00:50

graph shows the dead weight loss in the

play00:52

case of a consumption tax levid on the

play00:54

supplier consumption taxes such as sales

play00:57

tax increases the cost of goods and

play00:59

services for consumers and it can be

play01:01

shown in the rectangle as consumer tax

play01:04

and producer tax as a result individuals

play01:07

and households May reduce their spending

play01:09

on these items and this reduces the

play01:12

overall level of consumer spending and

play01:13

Supply in the

play01:15

economy consumption taxes increases the

play01:17

cost of production reducing willingness

play01:19

and ability to supply goods and services

play01:21

at the same level and this then result

play01:24

in the leftward shift and the S curve

play01:26

showing reduced Supply furthermore the

play01:29

increase in the consumer spending also

play01:31

leads to a lower level of overall demand

play01:33

in the economy now be talking about

play01:35

consumer welfare and producer welfare so

play01:38

consumer welfare because the supply

play01:40

shifts upward due to the consumption tax

play01:42

the new market price is higher than the

play01:44

pre-tax price therefore consumer

play01:47

supplies decreases as consumers now pay

play01:49

a higher price for the same quantity

play01:52

causing the demand to decrease and it

play01:54

can be seen from the movement along the

play01:55

demand curve as price increase does not

play01:58

cause a shift in the demand curve

play01:59

there's only movement along the demand

play02:01

curve for the producer welfare the

play02:04

producer Supply will decrease as well

play02:06

because producers receive a lower price

play02:08

due to the impos tax reducing profits

play02:12

since consumption and production of cons

play02:14

consumers and production decreases it

play02:16

creates a gap between equilibrium 1 and

play02:19

equilibrium 2 CA the dead weight loss

play02:21

which is labeled in the orange

play02:24

triangle so what is dead with loss it is

play02:26

basically the market inefficiency and

play02:28

underproduction caused by taxes

play02:30

it is the area that represents the r

play02:33

reduction in overall economic welfare

play02:35

due to the consumption tax it is the net

play02:37

loss of both consumer and producer

play02:41

welfare now I'll be talking about the

play02:43

Taris tariff which is a tax on import

play02:45

that is imposed by the government so in

play02:48

a free trade scenario the market

play02:50

equilibrium is determined by the

play02:52

intersection of the domestic Supply and

play02:54

Global demand

play02:55

curves as the government imposes a tax

play02:57

on Imports this effectively raise raes

play03:00

the price by consumers and lowers the

play03:02

price received by producers thus the new

play03:05

equilibrium price shifts upwards by the

play03:06

amount of the Tariff the demand and

play03:08

Supply diagram without tariff domestic

play03:10

consumers can purchase imposed

play03:13

Goods when tariff is introduced the

play03:17

price of the imported goods Rises

play03:19

causing domestic producers to supply

play03:21

more and domestic consumers to demand

play03:23

less the difference between the new

play03:25

demand and Supply is the reduced

play03:27

quantity of imports the government

play03:29

revenue is from the Tariff but the

play03:32

market experiences a dewe loss so the

play03:34

dewe loss in question two is a

play03:37

triangular region similar to question

play03:38

one but it lies between the domestic

play03:40

supply and demand curves so below the

play03:46

new price after tax but above the free

play03:48

trade Supply thus shows the loss of

play03:50

overall economic welfare due to the

play03:53

Tariff however it is different to the

play03:55

cred loss from question one where the

play03:57

government collects taxes from the

play03:59

consumer and producer suppl places to

play04:01

summarize while tariff protects domestic

play04:04

Industries and generate revenue for the

play04:06

government this can also lead to

play04:09

inefficiencies and reduce welfare in the

play04:11

domestic economy the consumer surplus is

play04:14

the area underneath the demand curve

play04:16

above the price and since the price of

play04:18

the Tariff is higher consumer surplus is

play04:20

now lower because consumers pay higher

play04:22

prices for imported goods so domestic

play04:25

producers of similar Goods might benefit

play04:27

from the Tariff because it makes

play04:29

imported Goods more expensive making

play04:31

domestic Alternatives more attractive so

play04:33

they can produce more so therefore the

play04:35

produce supplies increases because

play04:37

producers can increase their production

play04:39

and sales due to the reduced competition

play04:41

from

play04:43

Imports for the next slide I'll be

play04:45

talking about the imposition of

play04:46

consumption taxes on the macroeconomic

play04:49

side so a consumption tax is a tax

play04:51

imposed on the purchase of goods or

play04:53

service and when a consumption tax is

play04:56

implemented it effectively raises the

play04:58

price of goods and services for

play05:01

consumers as a result consumers May

play05:03

reduce their spending as they have lower

play05:06

disposable income and this reduction in

play05:08

consumer spending can lead to a decrease

play05:11

in aggregate demand it can result in a

play05:14

shift in the aggregate demand curve to

play05:16

the left as seen on the

play05:17

diagram as analysis is focusing on the

play05:20

consumption the supply side will be

play05:22

ignored and there will be only movement

play05:24

along the short run aggregate supply as

play05:26

price decreases and price only cause the

play05:29

the along a movement along the

play05:33

curve so for the next SL I'll be talking

play05:35

about the health taxes and economic

play05:37

growth whether this can lead to a better

play05:39

GDP and boost the

play05:42

economy so a health tax impos on

play05:44

products that are harmful to heal such

play05:47

as sugary beverages tobacco products

play05:49

have a few benefits for the economy

play05:51

higher production cost causes a leer

play05:53

shift in the short run aggregate supply

play05:55

curve in the short run and this shift

play05:58

occurs because firms face high costs for

play06:01

producing and selling unhealthy Goods

play06:03

which reduces their willingness and

play06:05

ability to supply Goods at the previous

play06:08

levels the long-term impact on the long

play06:11

run aggregate supply curve depends on

play06:12

how the tax influences the economy's

play06:14

productive capacity so if the tax leads

play06:17

to improve Public Health such as reduce

play06:19

risk of chronic diseases increase

play06:21

Workforce productivity and longer

play06:24

lifespans it can then positively affect

play06:26

the long run aggregate supply curve a

play06:29

healthier Workforce can be more

play06:30

productive leading to an increase in

play06:32

economy productive

play06:34

capacity and this in turn shifts the

play06:36

long run aggregate supply curve to the

play06:38

right over time a tax on unhealthy Goods

play06:41

May reduce consumer spending on those

play06:43

items on the unhealthy goods and in the

play06:46

short run this could lead to a leftward

play06:48

shift in the aggregate demand curve as

play06:50

people reduce their consumption of such

play06:52

Goods however in the long run if the tax

play06:55

leads to improve Public Health outcomes

play06:57

it can positively affect the ad C Earth

play07:00

a healthier population is generally more

play07:01

productive and may have a increased

play07:03

disposable income due to the reduced

play07:05

Healthcare cost so this can lead to

play07:08

increased consumer spending and a

play07:10

rightward shift in the ad curve over

play07:13

time in the long run so to sum up a tax

play07:16

that improves people's heal Health has

play07:18

long-term benefits for the economy

play07:20

because the increased in productivity

play07:22

which boosted the real GDP leading to

play07:25

economic

play07:28

growth

play07:29

an econometric model can be applied to

play07:32

find the correlation between tax that

play07:33

improves People's Health and economic

play07:35

growth a d can help identify potential

play07:38

core Founders and guide the econometric

play07:41

analysis for example fat taxes are now

play07:44

imposed worldwide to control a negative

play07:45

Health outcome by taxing unhealthy

play07:48

products it can be also interpreted in

play07:50

the econometric model that a fat tax is

play07:52

an independent variable and the heal is

play07:56

a dependent variable the dependent

play07:58

variable which is Health relies on the

play08:00

independent variable fat taxes as the

play08:02

imposing fat taxes is projected to bring

play08:04

a better and positive Health outcome in

play08:07

society however government are aware

play08:10

that imposing fat tax May decrease the

play08:12

economy in the short run as a negative

play08:14

wealth effect however in the long run if

play08:17

the overall health in society increases

play08:19

by imposing fat taxes it is likely to

play08:23

increase the productivity of people

play08:24

which in turn improve the real GDP and

play08:27

the

play08:28

economy therefore the co founder will be

play08:30

the economy as economy can be impacted

play08:33

by both fat taxes and health and adding

play08:36

the economy variable allows us to absorb

play08:39

the negative and positive relationship

play08:41

to discover the true effect of imposing

play08:43

fat taxes that is the end of my

play08:45

presentation thank you for listening my

play08:47

name is Andrew good day

Rate This

5.0 / 5 (0 votes)

相关标签
Economic ImpactTax AnalysisConsumer WelfareProducer WelfareDemand and SupplyDeadweight LossTariff EffectsHealth TaxesEconomic GrowthMacroeconomics
您是否需要英文摘要?