Hypothesis Testing - Difference of Two Means - Student's -Distribution & Normal Distribution
Summary
TLDRThis video covers hypothesis testing using two-sample means, focusing on comparing the performance of two teachers based on students' final exam scores. The first class has 15 students with a mean score of 82 and a standard deviation of 2.4, while the second class has 12 students with a mean score of 84 and a standard deviation of 1.7. Using a t-test and a 5% significance level, the video walks through calculating degrees of freedom, critical t-values, and rejection regions, concluding that there is a significant difference between the two teachers' performances.
Takeaways
- 📊 Two-sample hypothesis test is used to compare the performance of two teachers.
- 📏 First class has a mean score of 82, standard deviation of 2.4, and sample size of 15.
- 📏 Second class has a mean score of 84, standard deviation of 1.7, and sample size of 12.
- 🔬 Null hypothesis states no difference between the two class performances (μ1 = μ2).
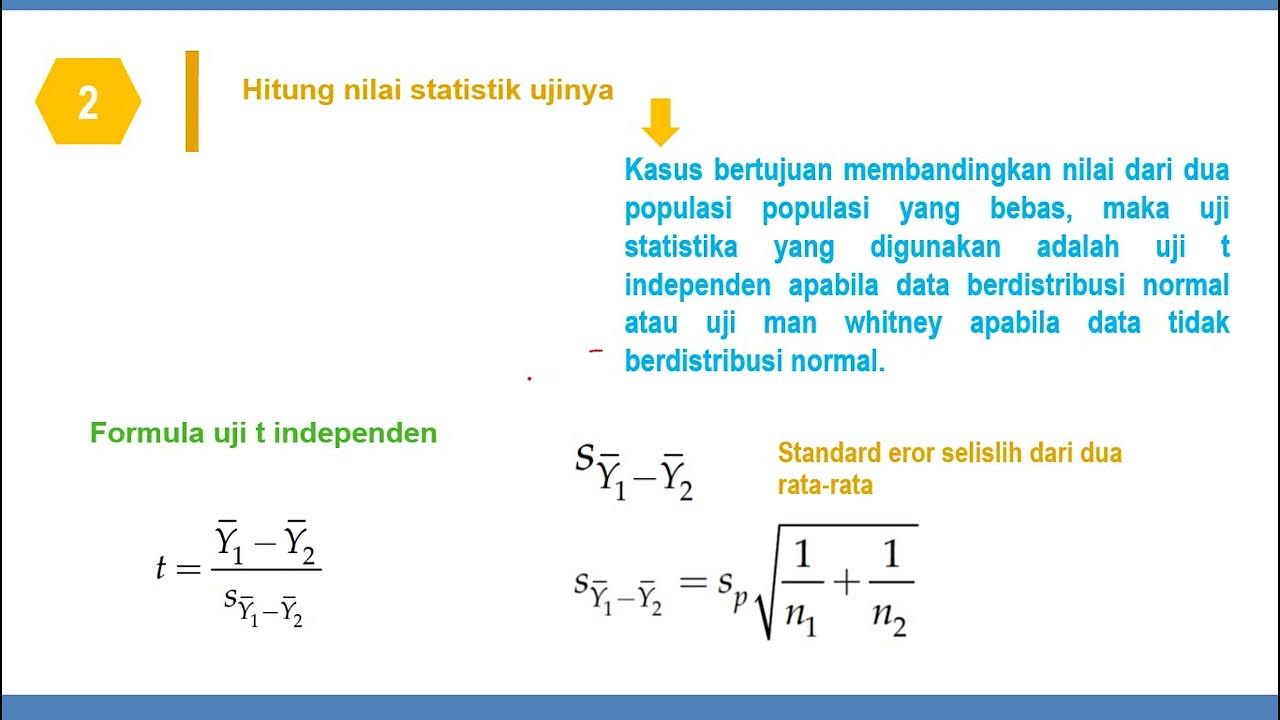
- 📉 Since the sample sizes are small (less than 30), a t-distribution is used for this test.
- 📐 Degrees of freedom are calculated using a specific formula, yielding approximately 25 degrees.
- 📊 Critical t-value at a 5% significance level and 25 degrees of freedom is 2.0595.
- ❌ Calculated t-value is -2.53, which falls into the rejection region, meaning the null hypothesis is rejected.
- ✅ Conclusion: There is a significant difference in performance between the two teachers.
- ⚖️ In a second example, a factory comparison shows significant improvement in a new factory's oil refining rate using a Z-test.
Q & A
What is the main objective of the problem presented in the video?
-The main objective is to determine if there is a significant difference between the performance of two teachers based on the final exam scores of students at a 5% significance level.
What are the sample sizes, means, and standard deviations for the two classes being compared?
-For the first class, the sample size is 15, the mean exam score is 82, and the standard deviation is 2.4. For the second class, the sample size is 12, the mean exam score is 84, and the standard deviation is 1.7.
What are the null and alternative hypotheses for the test?
-The null hypothesis (H0) is that there is no difference between the performance of the two teachers, meaning the mean scores are equal (μ1 = μ2 or μ1 - μ2 = 0). The alternative hypothesis (H1) is that the mean scores are not equal (μ1 ≠ μ2).
What type of distribution is used for this test and why?
-A t-distribution is used because the sample sizes for both groups are less than 30, which means the normal distribution is not appropriate.
How are the degrees of freedom calculated in this problem?
-The degrees of freedom are calculated using a complex formula that incorporates the sample sizes and standard deviations of both groups. After performing the calculations, the degrees of freedom are approximated as 25.
What is the critical t-value for a two-tailed test with 25 degrees of freedom at a 5% significance level?
-The critical t-value for a two-tailed test with 25 degrees of freedom at a 5% significance level (α = 0.05) is 2.0595.
What is the calculated t-value for the test, and how does it compare to the critical t-value?
-The calculated t-value is approximately -2.53. Since this value lies in the rejection region (less than the critical t-value of -2.0595), the null hypothesis is rejected.
What conclusion can be drawn from the test about the performance of the two teachers?
-The conclusion is that there is a significant difference in the performance of the two teachers at a 5% significance level.
What is the main objective of the second problem presented in the video?
-The objective of the second problem is to determine if there is a significant difference in the refining rates of an old factory and a new factory at a 10% significance level.
What statistical test is used for the second problem, and why?
-A z-test is used because both sample sizes are greater than 30, which allows for the use of the normal distribution.
Outlines

此内容仅限付费用户访问。 请升级后访问。
立即升级Mindmap

此内容仅限付费用户访问。 请升级后访问。
立即升级Keywords

此内容仅限付费用户访问。 请升级后访问。
立即升级Highlights

此内容仅限付费用户访问。 请升级后访问。
立即升级Transcripts

此内容仅限付费用户访问。 请升级后访问。
立即升级浏览更多相关视频

Independent-samples t-test in SPSS

Jenis-jenis pengujian hipotesis: Uji Beda Rata-rata (Uji z dan Uji t)

pengujian hipotesis rata-rata dan proporsi suatu populasi

Pengujian Hipotesis Deskriptif Satu Sampel

STATISTIKA - Uji T Sampel Bebas (Independent Samples T Test) Perhitungan Manual

independen t test menggunakan SPSS
5.0 / 5 (0 votes)
