Analyzing a cumulative relative frequency graph | AP Statistics | Khan Academy
Summary
TLDRThe video script discusses a cumulative relative frequency graph for sugar content in 32 Starbucks drinks. It explains how to read the graph to determine the percentile of a drink with 15 grams of sugar, identifying it as the 20th percentile. The script also estimates the median sugar content to be approximately 25 grams, as 50% of drinks have 25 grams or less. Lastly, it calculates the interquartile range, estimating the 25th percentile at around 18 grams and the 75th at 39 grams, resulting in an interquartile range of about 21 grams.
Takeaways
- 📊 The script discusses a cumulative relative frequency graph for sugar content in 32 Starbucks drinks.
- 🍬 It explains that 0% of the drinks have no sugar content, and 10% have 5 grams or less.
- 🎯 The percentile of an iced coffee with 15 grams of sugar is estimated to be in the 20th percentile based on the graph.
- 🔍 The median sugar content, representing the middle value of the distribution, is approximated to be 25 grams.
- 📈 The interquartile range is calculated by finding the 25th and 75th percentiles, which are estimated to be around 18 grams and 39 grams, respectively.
- ✂️ The estimated interquartile range, the difference between the first and third quartiles, is about 21 grams.
- 📋 The script provides a step-by-step guide on how to interpret a cumulative relative frequency graph to find percentiles and the interquartile range.
- 📊 Understanding the graph involves recognizing that each point represents the percentage of drinks with that amount of sugar or less.
- 📉 The cumulative nature of the graph means that as sugar content increases, the relative frequency also increases, showing the proportion of drinks with that sugar level or lower.
- 📝 The script uses the example of an iced coffee to demonstrate how to estimate the percentile for a specific sugar content.
Q & A
What is the purpose of the cumulative relative frequency graph discussed in the script?
-The cumulative relative frequency graph is used to show the distribution of sugar content in grams for 32 Starbucks drinks, illustrating how many drinks contain a certain amount of sugar or less.
How is the percentile of an iced coffee with 15 grams of sugar estimated in the script?
-The percentile is estimated by finding the cumulative relative frequency that corresponds to 15 grams of sugar on the graph, which is approximately 20%, placing the iced coffee in the 20th percentile.
What does the 50th percentile represent in the context of the Starbucks drinks data?
-The 50th percentile represents the median sugar content, where half of the drinks have 25 grams or less of sugar, based on the cumulative relative frequency graph.
How is the interquartile range of the distribution of drinks estimated from the script?
-The interquartile range is estimated by identifying the 25th and 75th percentiles on the graph, which are approximately 18 grams and 39 grams, respectively. The difference between these two values gives an estimate of the interquartile range, which is about 21 grams.
What does the term 'cumulative relative frequency' mean in the context of the script?
-In the context of the script, 'cumulative relative frequency' refers to the proportion of drinks that have a certain amount of sugar or less, as represented on the y-axis of the graph.
What is the significance of the 0.5 on the vertical axis of the cumulative relative frequency graph?
-The 0.5 on the vertical axis signifies the 50th percentile, indicating that 50% of the drinks have a sugar content of that amount or less.
How does the script describe the process of estimating the median from the cumulative relative frequency graph?
-The script describes estimating the median by locating the point on the graph where the cumulative relative frequency is 0.5 (50%), which corresponds to the sugar content that half of the drinks have or less.
What is the estimated sugar content for the 25th percentile of Starbucks drinks according to the script?
-The script estimates the sugar content for the 25th percentile to be approximately 18 grams of sugar.
What is the estimated sugar content for the 75th percentile of Starbucks drinks according to the script?
-The script estimates the sugar content for the 75th percentile to be approximately 39 grams of sugar.
How does the script suggest interpreting the cumulative relative frequency graph for understanding the distribution of sugar content?
-The script suggests interpreting the graph by converting the cumulative relative frequencies to percentages and understanding that these percentages represent the proportion of drinks with a certain amount of sugar or less.
Outlines

此内容仅限付费用户访问。 请升级后访问。
立即升级Mindmap

此内容仅限付费用户访问。 请升级后访问。
立即升级Keywords

此内容仅限付费用户访问。 请升级后访问。
立即升级Highlights

此内容仅限付费用户访问。 请升级后访问。
立即升级Transcripts

此内容仅限付费用户访问。 请升级后访问。
立即升级浏览更多相关视频
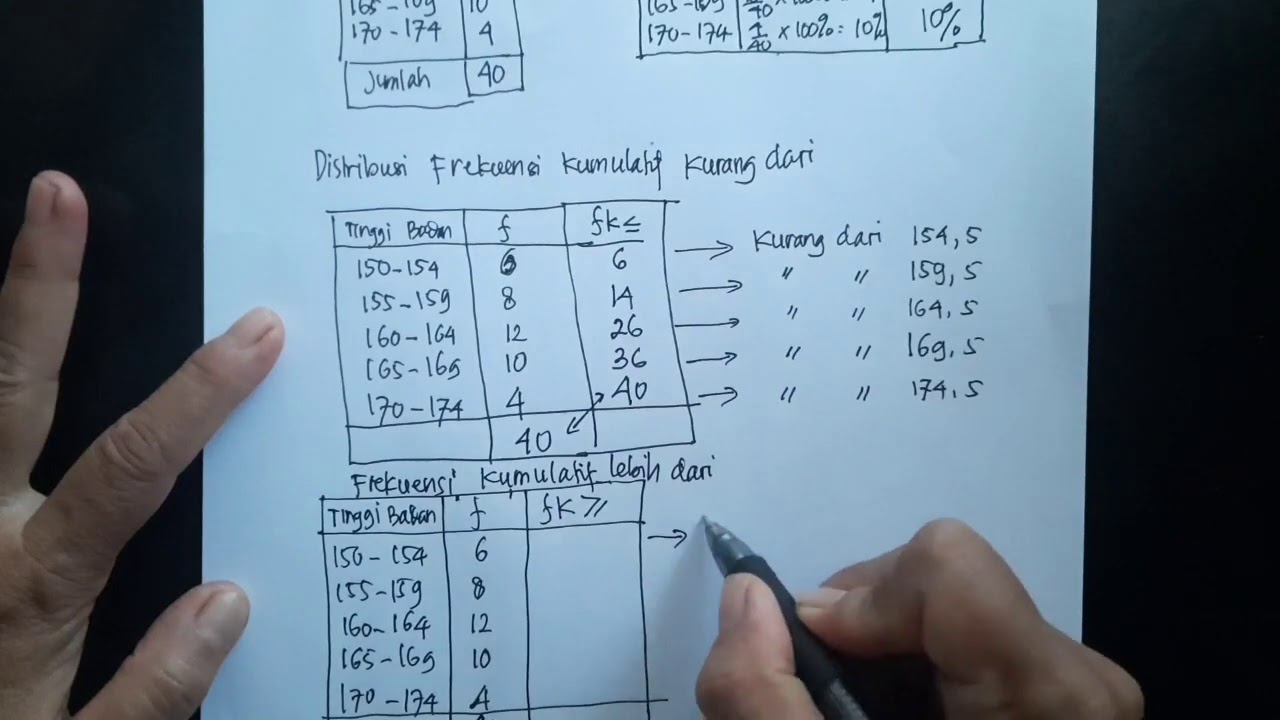
FREKUENSI RELATIF DAN FREKUENSI KUMULATIF, HISTOGRAM, DAN POLIGON
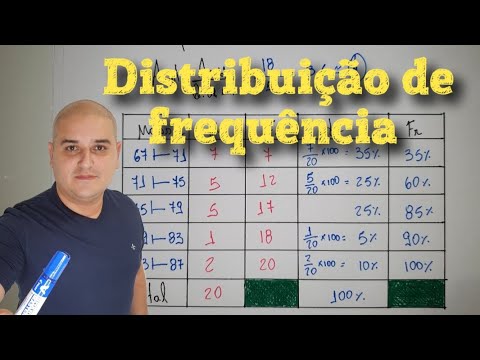
Distribuição de frequência com classes
Statistik : Penyajian Data - Part 4

TABEL DISTRIBUSI FREKUENSI KUMULATIF DAN RELATIF
Statistika 05 | Distribusi Frekuensi dalam Statistika | Frequency Distribution | Belajar Statistika

Representações Gráficas I | Estatística Básica 03
5.0 / 5 (0 votes)
