MALAYSIAN SNR FULL STRATEGY NO BS 2024

StreetTraderFx
15 Apr 202412:22

Summary

TLDRThis video tutorial delves into the concepts of support and resistance areas in trading, offering insights on how to identify and utilize these zones for profit-taking and anticipating market movements. The presenter emphasizes the importance of recognizing high momentum trades and provides practical examples using SNR (Support and Resistance) indicators. Viewers are guided on setting stop losses and identifying entry points, with a focus on confirming breakouts on lower timeframes for safer trading decisions. The content is educational and not financial advice, highlighting the need for personal risk management.

Takeaways

  • ๐Ÿ˜€ The video aims to educate viewers on how to use support and resistance areas in trading.
  • ๐Ÿ‘ The presenter encourages viewers to subscribe to not miss out on future videos.
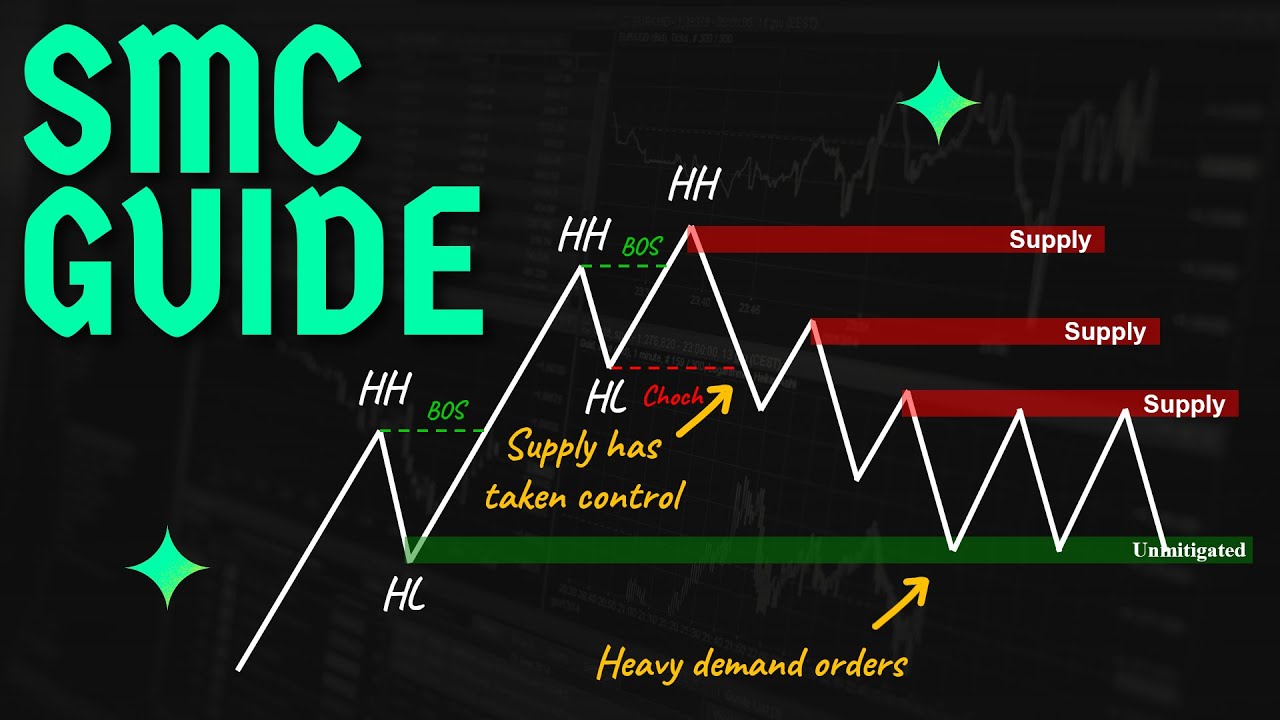
  • ๐Ÿ“ˆ Support and resistance areas are identified as barriers or 'ceilings' and 'floors' where prices struggle to break through.
  • ๐Ÿ“Š Resistance areas are typically marked by an up candle followed by a down candle, and support areas by a down candle followed by an up candle.
  • ๐Ÿ” Momentum is an important factor when identifying these areas, especially for high-momentum trades.
  • ๐Ÿšซ Not all visible areas on a chart should be used; it's crucial to know where and when to apply them.
  • ๐ŸŽฏ The presenter uses specific examples, including Ethereum's price movements, to illustrate the concepts.
  • ๐Ÿ“ A standard stop loss of 30 or 35 pips is suggested for risk management in the current market conditions.
  • ๐Ÿ”„ The video discusses scaling down to lower time frames for confirmation of trades and entry points.
  • ๐Ÿ“‰ The presenter anticipates a sell and explains how to identify potential entry and exit points using support and resistance areas.
  • ๐Ÿ’ก The video concludes with a reminder that the content is for educational purposes only and that trading is at the viewer's own risk.

Q & A

  • What is the main topic of the video?

    -The main topic of the video is explaining how to use support and resistance areas in trading, as well as how to determine take profit levels and anticipate market movements.

  • What does the acronym 'SNR' refer to in the context of the video?

    -In the video, 'SNR' refers to Support and Resistance, which are key concepts in technical analysis for identifying price levels where the asset's price tends to stop and reverse.

  • How is an area of resistance typically formed according to the video?

    -An area of resistance is typically formed by an up candle followed by a down candle, marking the first candle as the point of resistance regardless of any gap up in the following candle.

  • What is the importance of momentum when identifying support and resistance areas?

    -Momentum is important as it helps to confirm the strength of the support or resistance level. A strong momentum in the direction of the support or resistance indicates that the price is struggling to break through that level.

  • What does the video suggest for a standard stop loss in trading?

    -The video suggests a standard stop loss of 30 or 35 pips, especially when trading in areas that are forming an all-time high, due to the uncertainty of where the price might retrace or reverse.

  • Why is it recommended to look for confirmations on lower time frames?

    -Looking for confirmations on lower time frames is recommended to validate breakouts or reactions from support and resistance areas, especially when the higher time frame areas have been tapped.

  • What is the significance of the phrase 'your money, your own rules' in the context of the video?

    -The phrase 'your money, your own rules' emphasizes that any trading decisions made by the viewer are their own responsibility, and the information provided is for educational purposes only, not financial advice.

  • How does the video suggest traders should approach scaling into trades on lower time frames?

    -The video suggests that traders should scale into trades on lower time frames based on their comfort level and by using the breakouts or reactions from support and resistance areas as entry points, with a stop loss set accordingly.

  • What is the potential target for a sell trade as described in the video?

    -The potential target for a sell trade, as described in the video, is an area of support where the price is anticipated to find a bounce, using the previous highs and lows as reference points.

  • What does the video imply about the importance of not using every identified support and resistance area?

    -The video implies that it's crucial to discern which support and resistance areas are relevant for trading and not to use every single one identified on the chart, as some may not be significant or valid in the current market context.

  • How does the speaker use the example of Ethereum to illustrate the trading concepts discussed?

    -The speaker uses the example of Ethereum's price action to illustrate the concepts of support and resistance, showing how the price struggles at certain levels and how traders can use these levels to anticipate potential trades and set their stop losses.

Outlines

00:00

๐Ÿ“ˆ Introduction to Support and Resistance Trading

The speaker begins by encouraging viewers to like the video and subscribe to the channel for more content. They introduce the topic of the video, which is to explain the concept of support and resistance areas in trading, as well as how to identify profitable trade opportunities. The speaker emphasizes the importance of understanding these areas for successful trading and provides a brief overview of what will be discussed in the video, including the formation of support and resistance areas and how to use them effectively.

05:00

๐Ÿ“‰ Detailed Explanation of Support and Resistance Formation

In this paragraph, the speaker delves deeper into how support and resistance areas are formed in the market. They explain that resistance areas are formed by an upward price movement followed by a downward movement, indicating a barrier that prices struggle to break above. The speaker clarifies that the resistance area is marked from the first candle, regardless of any gaps in the following candles. Similarly, support areas are identified by a downward candle followed by an upward candle, showing where the price finds a base to bounce back. The importance of momentum in these areas is highlighted, with the speaker advising traders to focus on trades with high momentum for more reliable signals.

10:01

๐Ÿš€ Trading Strategy and Entry Points Using Support and Resistance

The speaker discusses a specific trading scenario, using the concept of support and resistance to identify entry and exit points for trades. They mention a standard stop loss of 30 to 35 pips, especially in a volatile market environment where an all-time high is being formed. The speaker provides an example of a trade setup, explaining how to identify potential targets based on support areas and how to scale down to lower time frames for confirmation of breakouts. They also touch on the importance of not using every visible support and resistance area but rather selecting those that are most relevant and have been tested by the market.

๐Ÿ“‰ Risk Management and Confirmation of Trade Setups

In the final paragraph, the speaker continues to elaborate on the trading strategy, emphasizing the importance of risk management and confirming trade setups. They discuss the use of lower time frames to validate breakouts from resistance areas and to identify potential entry points for trades. The speaker also provides an example of a second entry point after a breakout, explaining how to use open and close prices to determine the strength of the resistance area. They conclude by reminding viewers that the information provided is for educational purposes only and that any trading decisions are at the viewer's own risk.

Mindmap

Keywords

๐Ÿ’กSupport and Resistance

Support and resistance are fundamental concepts in technical analysis, referring to price levels where the likelihood of a price reversal is high. In the video, the speaker discusses how to identify and use these areas to anticipate price movements and determine entry and exit points for trades. For example, the script mentions 'an area of resistance' as a barrier where prices are unwilling to rise above, and 'an area of support' where prices struggle to fall further.

๐Ÿ’กProfit Taking

Profit taking is the strategy of closing a trade to secure profits when a certain price target is reached. The video script mentions knowing 'where to take profit,' which is crucial for managing risk and maximizing gains in trading. It's about deciding the optimal point to exit a trade to lock in profits, which is often related to the levels of support and resistance.

๐Ÿ’กMomentum

Momentum in trading refers to the strength or speed at which a price is moving in a particular direction. The script emphasizes the importance of focusing on trades with 'High momentum,' such as a strong downtrend indicating a potential resistance area where the price is struggling to break above.

๐Ÿ’กCandlesticks

Candlesticks are graphical representations of price movements over a set time period, typically used in financial charts. The video script uses the terms 'up candle' and 'down candle' to describe specific types of candles that can help form areas of support and resistance, indicating market sentiment and potential reversal points.

๐Ÿ’กRejection

Rejection in the context of trading refers to a price level that the market refuses to surpass, often leading to a reversal. The script mentions 'the rejection that we seeing here,' which is used to illustrate how the price struggles to break above a resistance area, indicating a potential sell signal.

๐Ÿ’กBreakout

A breakout occurs when the price moves beyond a previously established support or resistance level, often signaling a strong trend continuation. The video discusses the importance of identifying breakouts, such as 'broke out from this area,' to decide entry points for trades.

๐Ÿ’กStop Loss

A stop loss is an order placed with a broker to sell a security when it reaches a certain price. It is designed to limit an investor's loss on a position. The speaker mentions a 'standard stop loss' of 30 or 35 pips, which is a risk management strategy to protect against excessive losses in volatile market conditions.

๐Ÿ’กPips

In the context of the foreign exchange market, a pip is the smallest amount by which a currency quote can change. The script uses '30 Pips' as an example of a stop loss amount, which helps traders quantify their risk and potential profit targets.

๐Ÿ’กTime Frames

Time frames in trading refer to the duration over which price data is analyzed, such as on a minute, hourly, or daily chart. The video script discusses scaling to 'lower time frames' for confirmation of breakouts or trends, which allows traders to refine their entry and exit strategies based on shorter-term price movements.

๐Ÿ’กLiquidity

Liquidity in trading refers to the ease with which an asset can be bought or sold without affecting its price. The script mentions using a 'low' as liquidity, which implies that the price level could be a point where there is enough market interest to facilitate trading without significant price impact.

๐Ÿ’กConfirmation

Confirmation in trading is additional evidence or signals that support a particular trade decision. The video script talks about looking for 'lower time frame confirmations' to validate a potential trade setup, such as a breakout at a higher time frame, which helps to increase the probability of a successful trade.

Highlights

Introduction to the video with a goal to reach 100, 200, or 500 likes depending on the number of views.

Explanation of how to use support and resistance areas in trading.

Importance of subscribing for updates on trading strategies.

Recap on the formation of support and resistance areas (SNR) for new viewers.

Description of resistance areas as barriers where prices struggle to break above.

Technique for marking resistance areas using the first up candle followed by a down candle.

Explanation of support areas marked by a down candle followed by an up candle.

Emphasis on the importance of momentum when trading with support and resistance areas.

Strategy for using high momentum trades to identify potential support and resistance areas.

Advice on not using every visible area on the chart but selecting significant ones.

Discussion on the current market situation with Ethereum crossing 3,200 and its implications.

Guidance on setting stop loss at 30 or 35 pips in high volatility situations.

Use of daily area resistance for identifying potential sell opportunities.

Method for confirming breakouts and entries using lower time frames.

Strategy for scaling trades on lower time frames for comfort and risk management.

Example of a potential sell continuation and how to target it using support areas.

Final thoughts on using the presented SNR method for trading and seeking further educational resources.

Disclaimer that the content is for educational purposes only and not financial advice.

Transcripts

play00:01

welcome back welcome back welcome back

play00:03

to another video let's get this to 100

play00:08

likes or 200 or 500 likes depending on

play00:12

how many views we get maybe 20K views

play00:14

who knows so anyway let's begin let's

play00:17

begin let's begin so today I'm going to

play00:19

give you that's just an edification to

play00:21

what we discussed on previous videos

play00:23

right I'm going to show you uh

play00:26

exactly how to use support and

play00:29

resistance areas right and also how to

play00:32

know where to take profit and also how

play00:34

to anticipate all right but the first

play00:37

thing the first thing let's let's just

play00:38

start let's just recap because some of

play00:40

you may be new so if you're new make

play00:42

sure that you hit the Subscribe button

play00:44

so that you don't miss out in any other

play00:46

videos so if you

play00:49

are if you are an old subscriber not an

play00:52

old if you already here before I don't

play00:55

know how to call it man welcome back

play00:58

welcome back welcome back so anyway

play01:00

let's let's let's let's just quickly

play01:02

discuss um SNR right let's just quickly

play01:06

discuss discuss how it's formed

play01:09

because it's going to be important for

play01:11

for for for you for you to know this so

play01:14

that we we can be able to explain

play01:16

everything properly all right I'm just

play01:18

going to explain everything here and I'm

play01:20

going to explain

play01:22

um how to how to use it

play01:27

rather should have just left this one

play01:29

here

play01:31

um yeah something like that let's Lo the

play01:36

phone okay okay so basically basically

play01:40

um this right here this right here is

play01:45

your area of resistance right and then

play01:49

the one on the right is your area of

play01:51

support So how do these areas form right

play01:54

let me just quickly label them uh

play01:57

resistance and then this area right here

play02:00

is an area of support right Malaysian

play02:03

SNR SNR both of them right here are just

play02:07

SNR right SNR so we're going to explain

play02:11

them in in detail right we're going to

play02:14

explain them in detail so for us to

play02:16

create an area of resistance right an

play02:18

area of resistance is basically just a

play02:20

barrier right a barrier or some some we

play02:24

call them the roof or the ceiling

play02:26

whatever they want to call them but it's

play02:28

just a barrier like an area where

play02:30

prices is not um willing to break above

play02:33

right so how how is this area formed

play02:36

usually we see it being formed by an up

play02:39

candle and then a down candle so how do

play02:41

we mark it up we mark it up from this

play02:44

first candle right here right this first

play02:46

candle right there this is where you

play02:48

mark up your area of resistance it

play02:50

doesn't matter if price gaps up on this

play02:52

following candle this why you mark it up

play02:54

you don't mark it up on the highest

play02:56

candle you mark it up on the first

play02:58

candle right the first candle being this

play03:00

one right here right there this where

play03:04

your area of resistance will be it

play03:06

doesn't matter if it gets down right

play03:07

here and closes here that's where your a

play03:09

of resistance will be right hopefully uh

play03:13

you understood that but in most cases

play03:15

you'll find it similar to this one so an

play03:18

area of support is basically just a down

play03:20

candle followed by an up candle right

play03:23

and it's very important that you also

play03:25

focus on momentum right but it does not

play03:28

mean that all the time it's going to be

play03:29

strictly um dependent on on the momentum

play03:32

of this following candle but most

play03:34

importantly you you need to focus on um

play03:37

trades which have um High momentum right

play03:41

so just like with this one just like

play03:42

with this resistance it's a buy so

play03:44

usually you'd want to to see something

play03:46

like that a momentum to the downside

play03:48

just to show you that uh price is really

play03:50

struggling to to break above and then

play03:52

this momentum shows that price is

play03:54

willing to go lower just like with here

play03:56

price is it's it's having a difficult

play03:58

time trading lower so

play04:00

it got like an area it's being supported

play04:02

to to go higher so anyway um let me see

play04:06

let me see let me see how's this I'm

play04:08

just checking my phone right now so

play04:10

ethereum crosses

play04:12

3,200 okay so fine hopefully you got

play04:17

that in mind right I'm not going to go

play04:19

into detail but also remember don't just

play04:23

use any area that you see it's also

play04:26

important to know where to use these

play04:28

areas right here just because because

play04:29

you see them on the chart does not mean

play04:31

you should use every single one so

play04:33

anyway let's just let's just continue

play04:35

and do and get into the video because

play04:38

right now I'm anticipating a sell okay

play04:41

fine what happened here we have this

play04:44

daily area right here where we have a

play04:46

buy and then a sell right you can see

play04:49

based on this week that price is

play04:50

actually really struggling to go higher

play04:52

so even closed bearish right although I

play04:55

did show you an example of um a

play04:58

resistance area being formed with a

play05:00

bearish candle closing below this fast

play05:02

candle right here still it's a valid um

play05:05

it's a valid uh area of resistance just

play05:08

because of this uh momentum that we we

play05:10

seeing here the rejection that we seeing

play05:12

here so what you do in this case right

play05:16

if if you are a risk Trader right I

play05:19

always say that uh my standard stop loss

play05:21

is 30 Pips or 35 Pips just because right

play05:24

now we are in an area whereby we are

play05:27

still forming an alltime high so we we

play05:29

are not really sure where price is

play05:31

actually going to stop and give us a

play05:32

retracement or reversal so standard 30

play05:37

Pips so you could be stopped out I don't

play05:40

know you could be stopped out uh let's

play05:43

just say 30 Pips around here so you just

play05:46

take the trade right there and then for

play05:48

potential targets targets always focus

play05:51

on areas of support right an area of

play05:54

support would be here so you would be in

play05:56

a sell anticipating that it would find

play05:59

support from here why am I saying here

play06:01

because I know you're looking at this

play06:02

candle thinking that it tapped this area

play06:04

but I don't think it necessarily tapped

play06:06

that area if we zoom in as you can see

play06:09

this area is still fresh we haven't yet

play06:11

tapped it so it's your potential Target

play06:13

and then this low can be used as

play06:15

liquidity right but for those of you who

play06:18

would like to uh get in with a proper

play06:21

confirmation you can basically just

play06:24

scale down to lower time frames right

play06:26

lower time frames I would say I'm not

play06:28

really sure where this uh this day start

play06:30

let's see the Toth Friday already tapped

play06:33

here let's go to lower time frames I

play06:35

just want to make it uh very very simple

play06:38

let's see this started here right 15th

play06:41

the 15th tapped the area of resistance

play06:43

right here the daily resistance right

play06:46

this is today is it today today's the

play06:48

15th right am I wrong yeah yeah yeah so

play06:51

we tapped this area right here I'm

play06:54

basically just waiting for this candle

play06:55

to close we'll talk about that in a few

play06:57

minutes so our focus is right here right

play07:02

let's say you didn't want to enter with

play07:03

a 30 bit stop loss right because that's

play07:05

the highrisk trade you basically just

play07:08

scaled on Lower time frames depending on

play07:11

whether you're comfortable with it or

play07:13

not right depending on whether you're

play07:15

comfortable with it or

play07:16

not

play07:19

so you could have either decided that

play07:21

okay fine um we tapped this area right

play07:27

here and then reject it right right we

play07:30

did not really see any breakout then

play07:31

price pushed a bit higher traded lower

play07:34

and then pushed a bit higher to tap this

play07:36

area of resistance you shouldn't use it

play07:38

because there's no breakout yet right

play07:41

but then after reacting from here it

play07:43

broke out from this

play07:46

area this move hold on hold on hold on

play07:49

hold on just want to quickly confirm

play07:50

something broke up from this area with

play07:52

this move so fast area or first entry

play07:55

you could have taken it from here right

play07:57

if you use the line chart let me use

play07:59

quickly show

play08:01

you if you use the line

play08:04

chart where is that hold

play08:07

on you'll see the breakout right here

play08:10

but it's not really a breakout because

play08:12

of I would prefer close below here I

play08:15

would prefer to close below here but

play08:16

based on uh the

play08:19

candles based on how it directed here

play08:22

you could have just decided to enter but

play08:24

still not not a very very safe trade

play08:29

so in this case what I did I just marked

play08:32

up these areas right here and remember

play08:35

if you're not seeing anything clear

play08:37

remember we we tapped the daily area of

play08:39

resistance right so this is enough

play08:43

reason for you to look for lower time

play08:45

frame confirmations because you know we

play08:47

tapped a higher time frame area of

play08:48

resistance so you can you can just

play08:51

simply go to lower time frames just to

play08:53

confirm your breakout and all that so

play08:57

let's see after it broke out from here

play08:59

here right you went to the M15 and then

play09:03

you saw it trading a bit lower making a

play09:05

high and then you got a breakout from

play09:07

here your first entry obviously had to

play09:11

have been

play09:14

here had to have been

play09:17

here with the 30 stop

play09:23

loss with the 30 pip stop loss or 35

play09:27

Pips depending on what you're

play09:28

comfortable with your target here right

play09:32

here 300 Pips just like

play09:36

that so this would have been your

play09:39

potential first entry I'm just showing

play09:41

you these uh setups on on Lower time

play09:44

frames but I hardly ever use lower time

play09:46

frames so let's just say this the

play09:48

breakout right here maybe a second

play09:51

breakout would have marked it up from

play09:53

here and

play09:54

then the only area that you would have

play09:56

had here is this open close because this

play09:59

area right here this area of resistance

play10:01

has been used so second entry you could

play10:03

have marked it up from

play10:05

there and I know that this is

play10:11

hindsight because I know some of you

play10:13

will be in the comments or bro this is

play10:16

just hind slight you don't even know

play10:17

what you're doing another area right

play10:19

here I think I think this one let's just

play10:21

zoom in you can see this one this buy

play10:23

and then sell has been tapped so you

play10:25

would have just decided to use this uh

play10:28

open close because

play10:29

you you have to pick up pick out the the

play10:32

top two areas that um you want to to

play10:36

sell

play10:43

from just like that Target right there

play10:48

so right now right now I'm seeing the

play10:51

same thing right here I'm not really

play10:54

sure if it's going to come back or not

play10:56

but I was waiting for price to close on

play10:59

the 1 hour if we go back to the 1 hour

play11:02

you'll see on the 1 hour we have this

play11:04

open lose right there

play11:08

so we can just simply wait for for price

play11:11

to retrace into this one hour area and

play11:14

then we get um a possible sell

play11:19

continuation oh

play11:23

man a possible sell continuation um

play11:27

targeting here but my main target is

play11:31

obviously around here and I think I did

play11:33

discuss it but I haven't yet made any

play11:35

video regarding that

play11:38

so yeah that's basically just um a small

play11:41

small breakdown using my Legend SNR so

play11:46

if it's something that you're interested

play11:47

in make sure to to watch some of the

play11:50

videos which I did post on here on my

play11:52

YouTube or yeah yeah just basically just

play11:55

follow me follow me on telegram the

play11:57

first link in the description

play12:00

and uh yeah I'll talk to you guys soon

play12:02

love you boys um let's see how do we

play12:05

stop this man anyway this is not

play12:08

Financial advice anything that you do

play12:09

it's basically your own risk your money

play12:12

your own rules I did I did not tell you

play12:14

what to do with your own money I'm just

play12:16

speculating that's only for educational

play12:18

purposes only so anyway with that said

play12:20

peace love you boys

Rate This
โ˜…
โ˜…
โ˜…
โ˜…
โ˜…

5.0 / 5 (0 votes)

Related Tags
Trading StrategiesSupport ResistanceRisk ManagementTechnical AnalysisMarket EducationProfit TargetsPrice ActionTrading PsychologyFinancial MarketsEducational Content