Statistics-Left Skewed And Right Skewed Distribution And Relation With Mean, Median And Mode

Krish Naik
8 Apr 202106:51

Summary

TLDRIn this informative video, Krishnak discusses common examples of right and left skewed distributions, such as wealth distribution and human lifespan, and explains their characteristics. He also clarifies the relationship between mean, median, and mode in these distributions, noting that in right skew, mean > median > mode, while in symmetrical distributions like normal distribution, mean β‰ˆ median β‰ˆ mode, and in left skew, mode > median > mean. Krishnak emphasizes the importance of practical knowledge for better understanding and explanation of these concepts.

Takeaways

  • πŸ“š The video discusses a statistical question related to skewness in data distributions that was asked in an interview.
  • πŸ“ˆ The script explains the concept of right skew distribution, where the right tail of the data distribution is elongated, compared to the left.
  • πŸ’° Wealth distribution is given as a classic example of a right skew distribution, highlighting the few extremely wealthy individuals compared to the majority with less wealth.
  • ✍️ The length of comments on the speaker's YouTube channel is used as another example of a right skew distribution.
  • πŸ“Š The script contrasts right skew distribution with symmetrical (normal) distribution, which includes examples like age, weight, and height distributions.
  • 🌟 Machine learning algorithms often prefer data that follows a normal distribution, as it simplifies the modeling process.
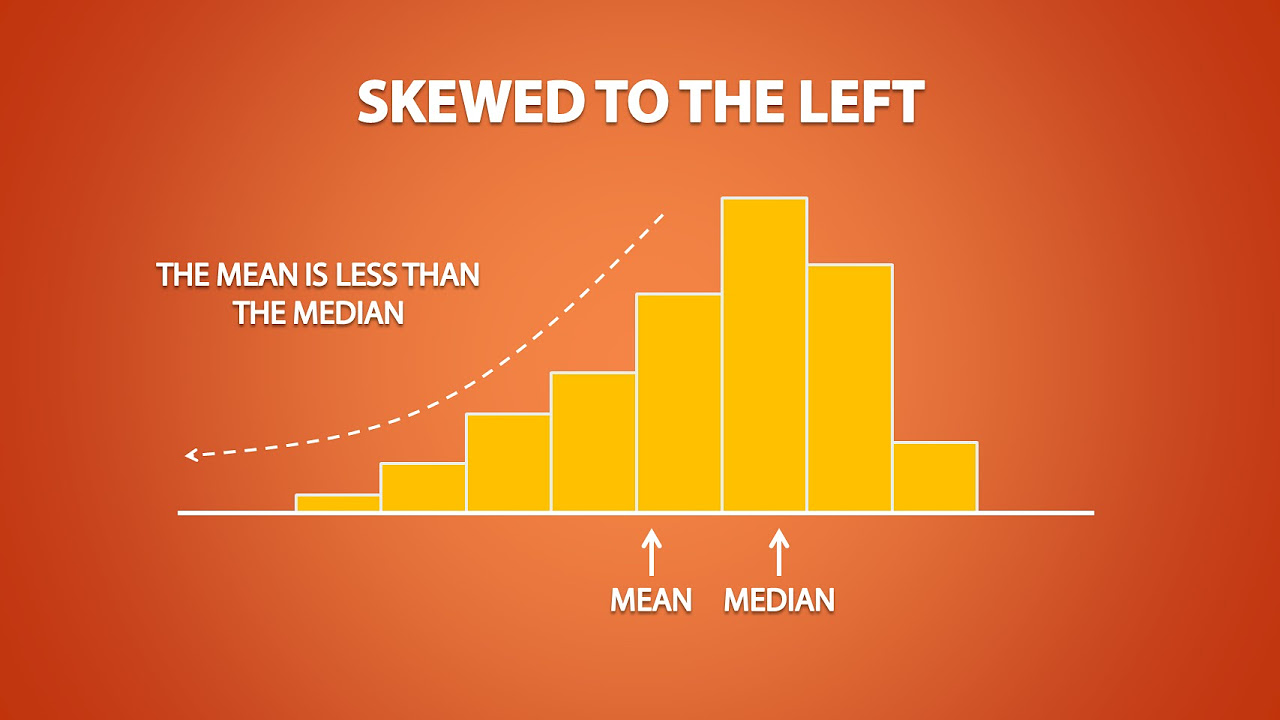
  • πŸ”„ The left skew (or negative skew) distribution is also explained, with the lifespan of humans given as an example, where few live much longer than the average lifespan.
  • πŸ”’ In a right skewed distribution, the mean is greater than the median, which in turn is greater than the mode.
  • βš–οΈ For symmetrical distributions, the mean, median, and mode are approximately equal, reflecting the balance of the data.
  • πŸ“‰ In left skewed distributions, the mode is the highest, followed by the median, and then the mean, indicating the concentration of data towards the lower end.
  • πŸ€“ The importance of understanding and being able to explain theoretical concepts with practical examples is emphasized for effective communication in interviews.

Q & A

  • What is the main topic discussed in the video?

    -The main topic discussed in the video is the concept of right skew distribution and left skew distribution, along with examples and the relationship between mean, median, and mode in these distributions.

  • What is a right skew distribution?

    -A right skew distribution, also known as a positively skewed distribution, is a type of distribution where the tail on the right side is longer or fatter than the left side, indicating that the data has a longer tail to the right.

  • Can you provide an example of a right skew distribution mentioned in the video?

    -One example of a right skew distribution mentioned in the video is wealth distribution, where a few extremely wealthy individuals like Elon Musk and Jeff Bezos represent the long tail on the right side of the distribution.

  • What is a left skew distribution?

    -A left skew distribution, also known as a negatively skewed distribution, is a type of distribution where the tail on the left side is longer or fatter than the right side, indicating that the data has a longer tail to the left.

  • Can you provide an example of a left skew distribution mentioned in the video?

    -The lifespan of human beings is given as an example of a left skew distribution, where there are fewer people living to very old ages compared to the average lifespan, creating a longer tail on the left side.

  • What is the relationship between the mean, median, and mode in a right skew distribution?

    -In a right skew distribution, the mean is greater than the median, and the median is greater than the mode. This is because the long tail on the right side pulls the mean to a higher value than the median.

  • What is the relationship between the mean, median, and mode in a left skew distribution?

    -In a left skew distribution, the mode is the highest, followed by the median, and then the mean. This is because the long tail on the left side pulls the mean to a lower value than the mode.

  • What is a symmetrical distribution and what is an example mentioned in the video?

    -A symmetrical distribution is one where the right and left sides of the distribution are mirror images of each other. An example mentioned in the video is the normal distribution, which is often seen in features like age, weight, and height in datasets.

  • What is the relationship between the mean, median, and mode in a symmetrical distribution?

    -In a symmetrical distribution, the mean, median, and mode are approximately equal, as the distribution is balanced with no skew to either side.

  • Why is it important to understand the relationship between mean, median, and mode in different types of distributions?

    -Understanding the relationship between mean, median, and mode in different distributions is important because it helps in interpreting the data correctly. It can indicate the presence of outliers, the central tendency, and the skewness of the data, which are crucial for data analysis and decision-making.

  • How can one remember the relationship between mean, median, and mode in different distributions?

    -One can remember the relationship by visualizing the distribution diagrams and associating the positions of mean, median, and mode with the direction of the skew. For right skew, mean > median > mode; for symmetrical, mean β‰ˆ median β‰ˆ mode; for left skew, mode > median > mean.

Outlines

00:00

πŸ“Š Introduction to Skewness in Data Distribution

Krishnak introduces a statistical question from a recent interview, focusing on right and left skew distributions. He explains the concept of skewness by describing the shape of a histogram or kernel density estimator and provides examples of right-skewed data, such as wealth distribution featuring billionaires like Elon Musk and Bill Gates. He also mentions the length of comments on his YouTube channel as another example. The explanation is aimed at helping viewers understand the basic concept of skewness and its practical applications.

05:02

πŸ“š Understanding Mean, Median, and Mode in Skewed Distributions

The second paragraph delves into the relationship between mean, median, and mode in different types of distributions. Krishnak clarifies that in a right-skewed distribution, the mean is greater than the median, which in turn is greater than the mode. For a symmetrical distribution, like the normal distribution, the mean, median, and mode are approximately equal. In contrast, for a left-skewed or negative skew distribution, the mode is the highest, followed by the median and then the mean. Krishnak emphasizes the importance of knowing examples to explain these concepts effectively and encourages viewers to apply theoretical knowledge to practical scenarios.

Mindmap

Keywords

πŸ’‘Right Skew Distribution

Right skew distribution, also known as positive skew, is a type of data distribution where the tail on the right side is longer or fatter than the left side. This indicates that the majority of the data points are concentrated on the lower end, with fewer data points spread out towards the higher end. In the video, wealth distribution is given as a classic example where a few extremely wealthy individuals like Elon Musk and Jeff Bezos represent the long tail on the right, while the majority of people have less wealth.

πŸ’‘Left Skew Distribution

Left skew distribution, or negative skew, is the opposite of right skew, where the tail on the left side of the distribution is longer. This means that the data points are more spread out towards the lower values, with fewer points at the higher end. The lifespan of human beings is used as an example in the video, where many people die at a younger age, but a smaller number live well beyond the average lifespan, creating a long tail on the left.

πŸ’‘Symmetric Distribution

A symmetric distribution is one where the data is evenly spread out around a central point, with both ends mirroring each other. The normal distribution, or Gaussian distribution, is a prime example of this, where the mean, median, and mode are all equal. The video mentions that many features in machine learning datasets, such as those in the iris dataset, follow this distribution, which is preferred by most machine learning algorithms.

πŸ’‘Mean

The mean, often referred to as the average, is a measure of central tendency that is calculated by summing all the values in a dataset and then dividing by the number of values. In the context of the video, the mean is discussed in relation to skewed distributions, where in a right skew, the mean is greater than the median due to the influence of extreme values on the right.

πŸ’‘Median

The median is the middle value of a dataset when the values are arranged in ascending order. It is less affected by extreme values compared to the mean. In the video, the median is explained as being less than the mean in a right-skewed distribution and approximately equal to the mean in a symmetric distribution.

πŸ’‘Mode

The mode is the value that appears most frequently in a dataset. It is a measure of central tendency that can be used for both numerical and categorical data. In the video, the mode is described as being the smallest of the three measures of central tendency in a left-skewed distribution and the smallest in a right-skewed distribution.

πŸ’‘Histogram

A histogram is a graphical representation of the distribution of data, where data is grouped into bins or intervals, and the frequency of data points within each bin is represented by the height of the bars. In the video, histograms are mentioned as a way to visualize the skewness of a distribution, with right-skewed histograms having a long tail on the right side.

πŸ’‘Kernel Density Estimator

A kernel density estimator (KDE) is a way to visualize the distribution of data by smoothing the histogram into a continuous curve. It is used to estimate the probability density function of a continuous random variable. The video script mentions KDE as a method to identify the skewness of data distributions.

πŸ’‘Interview Question

The term 'interview question' in the video refers to the practice of preparing for job interviews by understanding and practicing responses to common and challenging questions. The video discusses a specific interview question related to statistical distributions, highlighting the importance of knowing both theoretical concepts and practical examples.

πŸ’‘Comment Length

Comment length is used as an example in the video to illustrate a right-skewed distribution in a non-traditional context. It refers to the varying lengths of comments people leave on videos, with some individuals writing very long comments, while most write shorter ones, creating a distribution that is skewed to the right.

πŸ’‘Iris Dataset

The iris dataset is a classic in the field of machine learning and statistics, often used for teaching and testing clustering algorithms. In the video, it is mentioned as an example of a dataset where features like petal length and width follow a symmetric distribution, which is ideal for many machine learning models.

Highlights

Introduction to the YouTube channel and the purpose of sharing interview questions.

The importance of uploading interview questions to an interview playlist for future reference.

A recent interview question about classical examples of right and left skew distributions.

Explanation of what constitutes a right skew distribution in data.

Wealth distribution as a classical example of a right skew distribution.

Length of comments on videos as an example of right skew distribution.

Introduction to symmetrical distribution, also known as normal distribution.

Examples of normal distribution in features of machine learning algorithms.

Iris dataset features following a normal distribution.

Definition and explanation of left skew or negative skew distribution.

Lifespan of humans as an example of a left skew distribution.

The relationship between mean, median, and mode in right skew distribution.

Mean being greater than median, which in turn is greater than mode in right skew distribution.

Mean, median, and mode being approximately equal in symmetrical distribution.

In left skew distribution, mode is the highest, followed by median and then mean.

The significance of understanding and remembering examples for explaining theoretical concepts.

Encouragement for viewers to subscribe to the channel for more interview question insights.

Transcripts

play00:00

hello all my name is krishnak and

play00:01

welcome to my youtube channel so guys

play00:03

morning ad actually asked you a

play00:04

statistical question which was recently

play00:06

asked

play00:08

in an interview to one of my subscriber

play00:10

as you all know guys

play00:11

most of the interview questions

play00:12

whichever i get to know i am definitely

play00:15

uploading that in my interview playlist

play00:17

and whenever i find out any new

play00:19

questions i'll probably make a video

play00:20

with respect to that

play00:22

so let me just tell you what was the

play00:23

question basically asked and for that

play00:25

in the morning also i had actually

play00:26

created a video many of you

play00:28

actually gave the right answer and yes

play00:31

many of you were also actually confused

play00:33

okay with respect to the question that i

play00:35

had asked so the question was that

play00:38

just tell us some of the classical

play00:39

examples of

play00:41

the right skew distribution and the left

play00:44

skid distribution

play00:46

and the second question was that what is

play00:47

the relationship between the mean

play00:49

median mode of right skill distribution

play00:52

and the left skill distribution now

play00:54

first of all we'll try to understand

play00:56

what exactly is right skew distribution

play00:57

and left skill distribution

play00:59

now guys whatever data you take and

play01:01

probably if you're trying to

play01:02

plot it in the form of histogram in the

play01:05

form of

play01:05

kernel density estimator and whenever

play01:08

you see

play01:08

this kind of right hand side elongated

play01:12

line right like this like this kind of

play01:14

distribution this is basically called as

play01:16

right skewed data okay

play01:20

that basically means your right side

play01:22

right hand side of this particular curve

play01:24

is little bit elongated when compared to

play01:26

the left hand side right

play01:28

now some of the classical examples over

play01:30

here so i'm just going to take some of

play01:32

the example

play01:33

the first example that i would like to

play01:34

take is wealth

play01:36

distribution this is a very classical

play01:39

example

play01:41

which recruiters also like to hear just

play01:44

imagine some of the top most richest

play01:45

people like elon musk

play01:47

jeff from amazon mark zuckerberg bill

play01:49

gates they usually fall in this

play01:51

particular region

play01:52

even ambani and they are very less

play01:54

number of people

play01:55

you know who follows in this specific

play01:57

reason whereas

play01:58

in this particular region you will be

play02:00

finding people with the same amount of

play02:02

wealth

play02:02

right this is one classical example the

play02:05

second classical example that i would

play02:06

like to take

play02:07

is probably you can you know that like

play02:11

you have seen my channel you have seen

play02:12

most of my videos guys you'll be seeing

play02:14

that some of the people like to

play02:16

write a longer comments right probably

play02:18

after seeing a video

play02:20

so length of the comments

play02:23

length of comments probably in my video

play02:26

this is also a classical example

play02:28

right so here you'll be seeing that some

play02:30

of the people will be writing

play02:31

longer comments they are also some of

play02:33

the people who will be writing smaller

play02:34

comments and some of the people

play02:36

will most of the people will be writing

play02:37

medium size comment probably one liner

play02:40

right so this is two classical examples

play02:42

that i want to give

play02:43

yes in the morning video many people

play02:44

gave some amazing examples itself

play02:47

right and you should also check out that

play02:49

again the link will be given in

play02:50

description

play02:51

now coming to the second uh distribution

play02:53

second distribution which is called a

play02:54

symmetrical distribution this is nothing

play02:56

but our

play02:57

normal distribution this is the example

play03:00

normal distribution i think we have

play03:02

worked out normal distribution with

play03:04

respect to our machine learning problem

play03:05

statement

play03:06

i'll get some of the algorithms once all

play03:08

of the features falling in this kind of

play03:09

most of the features falling in this

play03:11

kind of distribution itself

play03:12

some of the classical example is that

play03:15

age distribution

play03:16

probably weight distribution uh

play03:20

probably height distribution they all

play03:22

follow this kind of normal distribution

play03:25

and even if you have worked with iris

play03:26

data set you saw that in the iris data

play03:28

set you had features like petal length

play03:29

petalwidth sepal length and

play03:31

weight right that was also following

play03:33

this kind of normal distribution

play03:35

and remember guys most of the machine

play03:37

learning algorithm likes the data

play03:39

to have this kind of normal distribution

play03:41

property or

play03:43

and why it is called a symmetrical

play03:44

distribution because the right hand

play03:45

curve

play03:46

will almost be equal to the left hand

play03:47

curve okay

play03:49

so these are like mirror phase fine

play03:51

coming to the third kind of distribution

play03:53

which is also called as

play03:54

left cube distribution it is also called

play03:56

as negative skew distribution

play03:58

here the left hand side will be little

play03:59

bit elongated

play04:01

and then the right hand side right so

play04:03

here the perfect example i'll say

play04:05

lifespan of human being

play04:09

lifespan of human being

play04:14

because there are many people if i talk

play04:15

about the average lifespan

play04:17

it is somewhere around 50 to 70 so 50 to

play04:20

70 will basically be falling in this

play04:21

particular region

play04:22

there will be people who will be dying

play04:25

quite early in the age

play04:26

but they will be also very less number

play04:28

of people who will be living more than

play04:30

70 years probably near 100 and all

play04:32

again a perfect example to make you

play04:34

understand yes

play04:35

if you have some more examples

play04:37

definitely many people had also written

play04:38

in the morning

play04:39

and i i like most of the examples itself

play04:42

right

play04:43

now coming to the second question what

play04:45

is the exact relationship with respect

play04:47

to mean median and mode

play04:48

it is very very much simple just by

play04:50

seeing this particular diagram i think

play04:51

you will be able to know it guys

play04:53

mean in the right skewed distribution

play04:56

over here will be greater than median

play04:59

and median will be greater than mode

play05:02

right so mean will be greater than

play05:03

median and median will be greater than

play05:05

mode so this is the exact relationship

play05:07

that you will be able to find

play05:08

just by seeing this particular diagram

play05:09

will be able to understand in the case

play05:11

of symmetrical distribution

play05:13

mean will be approximately equal to

play05:16

median it will be approximately equal to

play05:19

mode so this is the second relationship

play05:22

that you find out with respect to normal

play05:23

distribution

play05:24

the third one basically what you see

play05:26

over here if i take this particular

play05:28

example over here your mode is highest

play05:32

then your median then your

play05:35

mean right so this is the exact

play05:38

relationship let me just write it down

play05:40

if you are getting confused

play05:42

first the highest will be mode

play05:46

then your median you have because median

play05:48

will be obviously smaller than mode

play05:50

then you have mean so this is the

play05:52

relationship that you find out with

play05:53

respect to the

play05:54

negative skewed data so this

play05:57

is what the interviewer may be expecting

play06:01

probably remember whenever this kind of

play06:02

questions are asked always make sure

play06:04

that you know some of the examples

play06:06

because if you tend to forget this

play06:08

particular topics also

play06:09

just with the help of those examples

play06:11

will be able to explain it in a proper

play06:13

way

play06:14

trust me guys practical knowledge

play06:15

definitely understanding of that

play06:17

theoretical is very very much important

play06:19

if you are able to relate this

play06:21

theoretical thing with some practical

play06:23

stuff

play06:24

you will be able to understand you will

play06:25

be able to relate once you able to

play06:27

relate it

play06:27

you will be able to understand you will

play06:29

be able to explain it okay

play06:31

so this is what i really wanted to cover

play06:33

just let me know whether

play06:34

you like this kind of thing or not

play06:36

because every day i'll at least come up

play06:38

with one interview questions probably

play06:40

and then i'll try to explain you

play06:41

completely from end to end so i hope you

play06:43

like this particular video please do

play06:44

subscribe the channel if you're not

play06:45

already subscribed i'll see you in the

play06:46

next video have a great day ahead

play06:48

thank you and all bye

Rate This
β˜…
β˜…
β˜…
β˜…
β˜…

5.0 / 5 (0 votes)

Related Tags
Skew DistributionStatistical AnalysisInterview QuestionsWealth InequalityComment LengthNormal DistributionMachine LearningIris DatasetLifespan AnalysisMean Median ModeData Interpretation