MMXM Trader V2 Forex Trading course- ICT Concept: 6.0 The Double Purge An Eye Opener to Liquidity
Summary
TLDRThe video script delves into the 'Double Purge' trading strategy, highlighting its significance in identifying market movements with low resistance. It emphasizes the importance of Smart Money Trade (SMT) and higher time frame Price and Order Flow (PD) arrays to predict reversals or continuations. The script provides a step-by-step guide on recognizing and leveraging the Double Purge pattern for high-probability trades, with examples illustrating its application in various market scenarios.
Takeaways
- π Market makers move price with low resistance after purging both sides of the market.
- π Use the double purge pattern in the direction of higher time frame institutional order flow.
- π SMT (Smart Money Technique) is crucial for identifying high probability order blocks.
- π Double purge can indicate both reversals and continuations in the market.
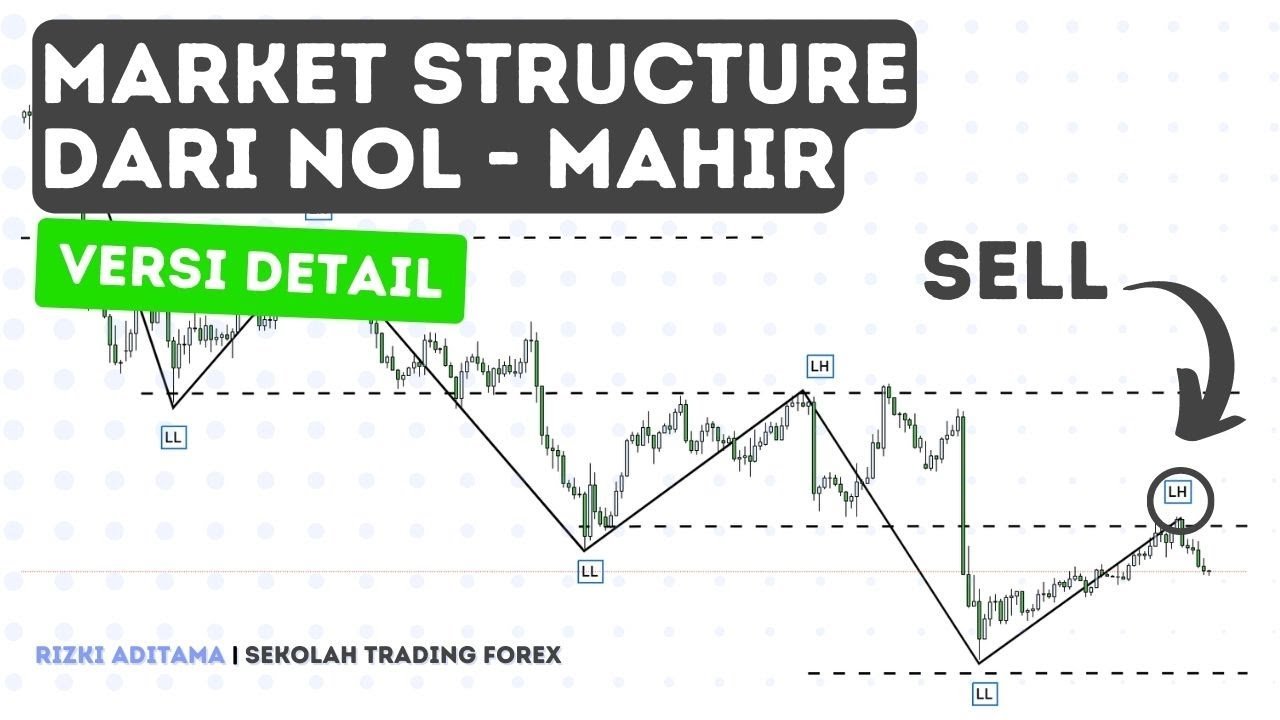
- π In bearish scenarios, sell stops are taken out first, then buy stops, forming a protected high.
- π In bullish scenarios, buy stops are taken out first, then sell stops, forming a protected low.
- π Order pairing of buy stops and sell stops is essential for determining market moves.
- π₯οΈ Mechanical approach: Purge stops in sequence to predict market direction.
- π Identifying premium and discount levels within the range is key for making trading decisions.
- π Example analysis: Double purge of stops followed by low resistance liquidity run confirms the market direction.
Q & A
What is the main focus of the 'double Purge' strategy discussed in the video?
-The 'double Purge' strategy focuses on liquidity by knocking out both sides of the market (sell stops and buy stops) to allow market makers to move the price with low resistance in the direction of higher time frame institutional order flow.
How can the 'double Purge' pattern be used in trading?
-The 'double Purge' pattern can be used for both reversals and continuations. It involves purging sell stops and buy stops to create high probability order blocks and fair value gaps, guiding traders on where to place stop-loss orders.
What role does SMT (Smart Money Technique) play in the 'double Purge' strategy?
-SMT is crucial in the 'double Purge' strategy as it helps identify high probability order blocks and fair value gaps. It increases the probability of successful trades by confirming protected highs and lows.
In a bearish scenario, what sequence of events should traders look for according to the 'double Purge' strategy?
-In a bearish scenario, traders should look for sell stops to be taken out first, followed by buy stops. After the buy stops are taken, SMT should be identified to form a high probability order block or fair value gap, indicating a protected high.
In a bullish scenario, what is the expected sequence of events in the 'double Purge' strategy?
-In a bullish scenario, buy stops should be taken out first, followed by sell stops. After the sell stops are taken, SMT should be identified to form a high probability order block or fair value gap, indicating a protected low.
What is the significance of the 'premium key PD array' and 'discount key PD array' in the 'double Purge' strategy?
-The 'premium key PD array' and 'discount key PD array' are crucial levels in the 'double Purge' strategy. They help traders identify areas where buy stops and sell stops should be accumulated, guiding the mechanical approach to trading.
Why is it important to accumulate sell stops below an old low and buy stops above an old high in the 'double Purge' strategy?
-Accumulating sell stops below an old low and buy stops above an old high is important because it sets up the order pairing necessary for the 'double Purge.' This ensures that once both sides are purged, the market can move in the desired direction with low resistance.
How does the 'double Purge' strategy ensure a low resistance liquidity run (LRLR)?
-The 'double Purge' strategy ensures a low resistance liquidity run by first purging both sell stops and buy stops, creating a situation where market makers can move the price in the real direction it wants to go with minimal resistance.
What is the importance of marking out premium and discount ranges in the 'double Purge' strategy?
-Marking out premium and discount ranges helps traders identify where the buy stops and sell stops are likely to be accumulated. This is essential for applying the 'double Purge' strategy effectively and ensuring trades are taken at high probability areas.
How can traders identify high probability order blocks or fair value gaps in the 'double Purge' strategy?
-Traders can identify high probability order blocks or fair value gaps by looking for SMT formations after the double purge of sell stops and buy stops. These formations indicate protected highs or lows, which are likely to result in successful trades.
What is the role of fractals in the 'double Purge' strategy?
-Fractals play a significant role in the 'double Purge' strategy as they allow traders to apply the pattern on various time frames. By identifying fractal ranges, traders can spot double purges and low resistance liquidity runs at different scales of price action.
How can traders use order blocks formed by the 'double Purge' strategy to place trades?
-Traders can use order blocks formed by the 'double Purge' strategy to place trades by entering positions at high probability areas such as discount fair value gaps or order blocks. These areas offer optimal entry points with minimal risk, ensuring effective trade execution.
What is the significance of a 'protected low' or 'protected high' in the 'double Purge' strategy?
-A 'protected low' or 'protected high' signifies a level where price is unlikely to return after the double purge. These levels are essential in the 'double Purge' strategy as they indicate the direction of the low resistance liquidity run, guiding traders on where to place stop-loss orders.
How does the 'double Purge' strategy help traders anticipate market moves during high impact news events like CPI releases?
-The 'double Purge' strategy helps traders anticipate market moves during high impact news events by identifying liquidity purges that occur before the news. By spotting these purges, traders can position themselves for the subsequent low resistance liquidity run triggered by the news event.
What is the key takeaway from the examples of the 'double Purge' strategy applied to various markets and time frames?
-The key takeaway is that the 'double Purge' strategy is a versatile and effective approach that can be applied to various markets and time frames. By understanding the mechanics of liquidity purges and SMT formations, traders can consistently identify high probability trading opportunities.
Outlines
π Understanding the Double Purge and Market Maker Behavior
This paragraph introduces the concept of the 'double purge' in trading, which is a strategy used by market makers to move the price with minimal resistance. It explains that market makers will only initiate significant price movements after liquidating both buy and sell orders, creating a scenario with low resistance. Traders are advised to align their trades with the direction of institutional order flow and price distribution arrays. The importance of spotting a 'smart money test' (SMT) is emphasized, as it indicates the formation of high-probability order blocks, which are crucial for determining stop-loss placement. The paragraph also outlines the mechanics of the double purge in both bearish and bullish scenarios, illustrating how the initial liquidation of sell stops or buy stops can lead to a significant price movement in the intended direction.
π Applying the Double Purge Strategy with Real Market Examples
The paragraph delves into practical examples of the double purge strategy, highlighting the importance of identifying premium and discount ranges and focusing on specific price actions. It discusses the significance of observing the accumulation and liquidation of buy and sell stops in relation to old highs and lows, which can indicate a protected low or high, respectively. The text guides through the process of identifying a double purge, from the initial purge of buy stops to the subsequent purge of sell stops, culminating in a low resistance liquidity run (LRLR). The paragraph also emphasizes the importance of the SMT in confirming the high probability of a protected price level, which can be used as a reference point for trade entries and stop-loss placement.
π Recognizing SMT and Its Role in Confirming High Probability Trades
This section underscores the role of smart money tests (SMT) in validating the high probability of a trade setup. It explains that after a double purge has occurred, the formation of an SMT on a higher time frame price distribution array (PD array) is a key indicator for a low resistance liquidity run. The paragraph provides examples of how to identify and analyze the double purge in both bullish and bearish market conditions, using GBP/USD and other currency charts. It also discusses the importance of zooming into different time frames to observe the nuances of the double purge and the subsequent price movements, which can lead to profitable trading opportunities.
π The Impact of Economic Data Releases on Double Purge Trades
The paragraph explores the impact of high-impact economic news, such as CPI releases, on double purge trades. It illustrates how the double purge can occur prior to such events, setting the stage for significant price movements. The text provides examples of how the market reacts to economic data, with the price action often reflecting the double purge pattern before the news release. It emphasizes the importance of identifying the double purge, the subsequent order block formation, and the expected low resistance liquidity run that follows, especially in the context of major economic announcements.
π Completing the Market Maker Sell Model with a Double Purge
In the final paragraph, the script concludes with an example of a market maker sell model, demonstrating how the double purge strategy can be applied to complete a sell trade. It describes a scenario where sell stops are purged first, followed by a price decline and a subsequent purge of buy stops. The paragraph explains how the energetic closing of candles below the lows can indicate bearish order flow, leading to the formation of a high probability order block. The text concludes by showing how a significant price drop can occur after a high impact news event returns to the order block, completing the market maker sell model.
Mindmap
Keywords
π‘Double Purge
π‘Liquidity
π‘Market Makers
π‘SMT (Smart Money Trade)
π‘Order Blocks
π‘Stop-Loss
π‘Protected High/Low
π‘PD Array
π‘Fair Value Gap
π‘Fractal
π‘CPI (Consumer Price Index)
Highlights
Introduction to the Double Purge concept and its significance in liquidity.
Market makers move price with low resistance after knocking out both sides of the markets.
Importance of aligning with higher time frame institutional order flow and PD arrays.
Double Purge can be used for both reversal and continuation patterns.
SMT (Smart Money Technique) is crucial for spotting high probability order blocks.
In bearish scenarios, sell stops are taken out first, followed by buy stops, forming a protected high.
In bullish scenarios, buy stops are taken out first, followed by sell stops, forming a protected low.
Key concept: Purging stops in a premium or discount key level.
After the Double Purge, market makers move the market with low resistance liquidity runs.
Mechanical approach: Sequentially purge stops to predict market direction.
Accumulate stops below old lows or above old highs to prepare for the Double Purge.
Once the stops are paired, market movement with low resistance becomes predictable.
Example: Crude schematic of price action for bearish and bullish scenarios.
Focus on premium and discount ranges to determine stop purging sequences.
SMT helps identify high probability order blocks, making trades more reliable.
Example: Detailed analysis of buy and sell stop purging on charts.
Market makers accumulate stops above highs and below lows to prepare for the Double Purge.
Low resistance liquidity runs are key to understanding market movements post Double Purge.
High probability order blocks form after SMT, crucial for setting stop-loss levels.
Detailed case studies of Double Purge in various market scenarios.
Mechanical and systematic approach to identifying Double Purge and executing trades.
Real-world examples of Double Purge and SMT leading to low resistance liquidity runs.
Focus on key levels and order blocks in higher time frames for accurate market predictions.
Importance of marking premium and discount levels on charts for effective Double Purge analysis.
Examples of Double Purge leading to significant market moves, including CPI releases.
Transcripts
so that concludes the swingo video Let's
head on over to the next topic which is
the double Purge an eye opener to
liquidity now we're going to be going
over a few points over here for the
double Purge those market makers will
only move price with low resistance
after they knock out both sides of the
markets now we want to use this in the
direction of the higher time frame
institutional orderflow and higher time
frame PD arrays and this pattern can be
used for both reversal and
continuations most important part over
here is smt we really want to spot that
smt to make it high probability because
why this is where the very high
probability order blocks form and if we
know what a high probability order block
is we also know where to put our stop-
loss above or
below so in a barass scenario sell stops
will be taken out first and then the buy
stops will be Tak
and what are we going to be waiting for
once those buy stops are taken we want
to see smt because that is where that
high probability order block and or fair
value Gap forms the high which took the
buy stops is very highly likely to be a
protected high and then again smt is key
here now in a bullish scenario we want
to see those buy stops getting taken out
first then the sell stops will be taken
and then again we want to be waiting for
that smt to form right because that high
probability the order block or fair
value Gap forms once that smt is formed
the low which took the sell stops is
very highly likely to be a protected low
and again smt is key over here over here
we got a crude schematic of price action
right we've got a line chart over here
for a bearish scenario we've got a line
chart over here for a bullish scenario
we've got our premium key PD array
outlined and our discount key PD array
so we have to approach this mechanically
right we want to see this F happen first
then that Etc so what are we going to be
waiting first we want to see those sell
stops purged or in a bullet scenario we
want to see those buy stops purged first
now why do we want those sell stops or
buy stops ped first think about the
order pairing video right rever back to
the previous videos we want to see those
sell stops accumulated below an old low
and those buy stops accumulated
above an old high so now that we have
accumulated the sell stops we want to
think about that order pairing right we
want to pair up the sell stops with the
buy stops or the buy stops with the sell
stops so how does that look like we're
going to purge the buy stop second over
here right we're going to take out the
high and now we're accumulating buy
stops over here and the key is in it has
to be in a premium key level over here
that PD array and then in a bullish
scenario we want to see that discount PD
array right now when both sell stops and
buy stops have been purged AKA The
Double Purge right then the market
makers will move the market in the real
Direction it wants to go with low
resistance liquidity run so now in a
bearish scenario first the sell stops
right then the buy stops perched which
is a double perch and then the lrlr
happens to this low and for the bullish
scenario same same occasion going to
purge the buy stops first accum ating
the buy stop pairing them up right order
pairing with the sell stops and then the
real move to the high happens which is a
low resistance liquidity run now what is
a key signature we want to see smt
happen on that higher time frame P PD
array so this is key double Purge and
smt for that low resistance liquidity
run now let's go over a couple of
examples so we can spot it on the charts
what are we going to look for right as
always Mark out your premium and
discount of the range and specifically
we're going to be focusing on this piece
of price action over here what happened
in this piece of price action so if I go
to the next slide we see buy stops and
sell stops resting above the high of the
range right the buy stops and the sell
stops resting below the range low so
what do we want to see first we want to
see those buy stops getting taken out
right the first part of the double Purge
then we want to pair up the buy stops
with the sell stops so sell stops pered
second down here accumulating those sell
stops now this low is highly likely to
be a protected low because we already
paired up the buy stops with the sell
stops right and then continuation up is
more probable what is key we're going to
be waiting for the double Purge right
and then we know the LR LR it will
happen into this High buy stops first
then sell stops then we have a protected
low formed and then we want to have the
real move which is a bullish move into
this high now we're going to be focusing
on this little fractal over here where a
large low resistance liquidity run
occurs and think about this high is a
target right in this whole range and now
we're going to zoom in on this piece of
price action which is a fractal range so
zooming in over here right we want to
see those buy stops and sell stops taken
out right the double Purge now why do we
want to have that we want to accumulate
those buy stops above that old high and
then pair them up with the sell stops
below it right now after we pair it up
we should have a protected low just like
in the example uh on the previous range
right we have this low here which should
be a protected low and now once we know
this is a protected low we should have a
low resistance liquidity run to the
highs which is on this High which purged
this range candle so if we zoom in a
little bit more right we have that piece
of price action over here but only we're
on a 4-Hour chart right the previous
slide was on a daily chart now same
thing happens over here right we've got
this
range and this is a fractal right we are
on 4 hour right now previous this was
the daily High and the daily low of the
range we can see the buy stops being
purged first then the sell stops and
then we have a protected low right and
what was key again mechanical approach
right we want to see one two then smt
happen for it making it a higher
probability protected low and then the
low resistance liquidity run should
happen into the high so zooming in a
little bit more now that we know that we
have smt we have a protected low we know
the lrlr is going to move into this high
so where does the opportunity lie we
always want to be a buyer in discount
right and we can actually see a 4-Hour
discount fair value Gap here uh which is
a perfect area to take along from so now
let's zoom out a little bit so we can
clearly see the sell side of the curve
and the buy side of the curve and think
about the previous video right mxm are
swing points we can actually see that we
have an original consolidation here so
sell out of the curve smart money
reversal what is key again smt right we
want to see that smt on the smart money
reversal then price moves up again and
then we are working with this fractal
range where we want to take a buy right
so buy stops were purged first then sell
stops protected low again smt is key so
where do you want to take a trade from
right the 4our F value Gap is the high
probability area where you want to be
taking a trade from now over here we can
also see after we purch the buy stops
right then the sell stops protected low
you can use that order block which is a
very high probability order block
because of that smt and because it's the
double Purge order block so now from
here on out you could also take a buy
from the order block into these highs
and then take profit above it right and
just outlining again over here that smt
is key on these lows so let's say you
did not get in on this order block is
there still an opportunity yes right
because we have a discount fair value
Gap coupled up with that high
probability order block so we know
because this is a highly likely to be a
protected low that you can put your stop
loss below that order block right and
enter from that discount for Value Gap
right so let's head in on the next
example over here you might already spot
what kind of model this is but let's
draw out the premium and discount range
first right this is the dealing range
we're working with we can see price
closes below inside this candle so it's
likely to run this low right and then
price dips back into discount and now we
can see the next candle takes out
previous daily low so let's zoom in a
little bit more on the one hour chart we
all know this is the X model right the
Twitter model from the mmm Trader I'm
going to dived in a little bit more how
the double Purge works on this specific
trade right so previous daily low gets
run first so we take external range
liquidity here right but what actually
happens if we zoom in on the 15minute
time frame we've got a previous daily
low low rate right but what happens
before we rate that previous daily low
first of all we purge those buy stops
right so we have a double Purge scenario
over here so we're accumulating the buy
stops bu that old high then running down
lower and then doing this the second
perch which is order pairing right we're
pairing up the buy stops with the sell
stops over here run previous daily low
and what do we know about the double
Purge we are creating a double Purge
order block which is a very high
probability order block where you can
take a trade from so we know that most
likely this is a protected low right
because we had the double Purge and then
we formed that order
block right so let's head in on the next
example we've got a GBP USD daily chart
over here and first of all we going to
spot the smt here right that is key
we've got this dealing range where price
broke back into into discount and then
moved away from here so we're going to
be focusing on this low resistance
liquidity run this whole move up here so
what do we notice right we've got smt
we've got a higher time frame key PD
array which is this order block right so
we're having a key level and what are we
going to be focusing on we're going to
be focusing on that double Purge right
so now we zoom in a little bit more
right and key thing is we're in a key
level the daily order block right so
let's take a look at this piece of price
action and see if you can spot a double
Purge over
here right we start off with this Range
High and this range low right we could
see buy stops are being taken out first
over here and notice how that high gets
broken through with strength right so
that indicates bullish institutional
order flow now we want to pair up those
buy stops with cell stops right so we
going to outline our range low down here
and we're going to purge that second now
after we purge the second one right the
sell stops we're going to focus in on
this piece of price action over here
because we want to catch that low
resistance liquidity run right so now we
know there should be a low resistance
liquidity run into the highs after we
purged the sell stops so we're going to
be focusing on what happens over here so
same thing happens over here right it's
all fractal so we can see those buy
stops purged over here that is the first
Purge right buy stops accumulated above
an old high then we want to see those
sell stops purged right on the Range low
order pairing eventually this is the
range low we want to be focusing on so
now what do we know once we form that SM
smt with the double Purge right it is
highly likely to be a protected low and
there will be a high probability order
block formed so over here we've got that
order block right we close above it so
we have a change in the state of
delivery we can see the next candle Taps
back into that high probability order
block right the wick is also part of the
order block as well as the body and can
see price is very willingly trading away
from that high probability order block
all right let's go over a bearish
example over here we've got a gbpusd
daily chart
again as always premium and discount
right we want to know where are we in
the range we are high up in premium over
here we can see smt had been formed on
these highs and now we know higher time
frame will be bearish once we close
below this candle right the change in
the state of delivery so let's zoom in
on the one hour chart over here and see
if you can spot the double Purge again
discount and premium of the range
right we can see those sell stops are
being taken out here so we are
accumulating sell stops now where do we
want to pair them up with with the buy
stops right so where is that Range High
over here so we purge those buy stops
and now we know because it's the double
perge right we want to see those sell
stops with the buy stops and then the
lrlr move or the low resistance
liquidity run should happen into the
lows now what is key again we want to
see that smt form on those highs so
after that smt is formed we're going to
be focusing on this fractal right this
large move down and you can see this is
low resistance liquidity because we move
swiftly down without chopping too much
right we can see that over here it's
chopping a little bit and then this
whole move is with low resistance so
over here we've got a schematic of a few
candles right how does that double purch
actually look like if we view it like
this we've got those buy stops over here
that gets perched by the second candle
second candle closes inside the range as
well think about the swing Point video
right then the third candle goes for the
range low this is where the second Purge
happens so we're accumulating the buy
stops pair them up with the sell stops
and then the real move should happen
which is a low resistance liquidity run
into these highs so same case over here
this is a bearish scenario right we want
to see those sell stops Purge first you
can see this candle closes inside of the
range of this candle goes for the buy
stops above it so we're pairing up again
order pairing right sell stops with the
buy stops and then the real low
resistance liquidity run should happen
into this low over here let's go over
another example over here we got a GBP
cat daily chart right and this is all
encompassing what is happening over here
we're going to explain why this candle
was a big bullish candle right a low
resistance liquidity run over here first
of all premium and discount right as
always you want to have a higher time
frame key level and then you're going to
be waiting for that double Purge to
occur right we want to see the buy stops
getting taken out first we can see that
over here then we take out the sell
stops and then we can see the fourth
candle actually right we have a swing
point over here which happens in a key
level the fourth candle runs up higher
why is the fourth candle Running Up That
High because the third candle did not
take out the Range High yet right so the
fourth can you either focus on the third
or the fourth candle for that range
expansion right so we've got another
example over here we got a Euro USD
chart again the double Purge right we've
got those sell s side taken out first
and then the buy s side and then there
will be a low resistance liquidity run
and actually this weekly candle had CPI
so we're going to see how that looks
like in the next example so we've got
that same Euro USD only this is a daily
chart right so we're going to be
focusing on this piece of price action
as always start off with mapping out
your premium and discount levels where
are you in the range right what is that
key PD a level so we've got a higher
time frame key level over here right
we've got the daily order block and we
can see price trades back into that
order block and then there is a low
resistance liquidity run lower but why
was there a low resistance liquidity run
lower this was the CPI candle right this
is a massive candle to the downside but
what happened prior right we got a sell
stop rate first over here right so we're
taking this candle's range we can see
the sell stops are being purged first of
all fall so we're accumulating those
sell stops then the buy stops are being
taken out and then the real move happens
right because we have a sell stop rate
first then we have a buy stop rate and
then the real move happens the low
resistance liquidity run down into this
low and this was on CPI as well so over
here we've got an execution as well that
the mxm trader took and we can see that
CPI candle delivering massively so we're
going to go over a few more CPI examples
because the double Purge happens before
those CPI releases and we're going to go
over how that looks like so first of all
we have a cat CPI right this massive
candle we've got a double perge
happening before it right so we take out
this buy stops first then we take out
the sell stop so we're order pairing and
then the low resistance liquidity run
should happen into the highs same thing
on the next CPI this is a pound CPI so
we had cat CPI first massive candle
then back into the range here notice
we're on on that order block here as
well GBP CPI candle over here massive
expansion again but what happened first
right we took out this buy stops first
over here on this candle range then the
sell stops got rated so now we know we
have a double Purge on this range and
then there should be a low resistance
liquidity run happening to the buy side
of the curve we've got another example
of where the MMX m Trader execute
this trade Right double Purge execution
take profit another Purge on the low
continuation Purge and then another
expansion over here all right so this
time we've got a NASDAQ chart over here
so we can see the key thing over here
right we want to see smt in that higher
time frame key level which is a daily
fair value Gap so we have a double perge
over here right we take out the sell
stops first then we take out the buy
stops inside the daily fair value cap
with smt and then the low resistance
liquidity run should happen to the
downside right then another one over
here we take out the sell stops first
and notice how we close inside the range
right from the previous video the swing
video candle closes inside so the third
candle is most likely to complete the
range of that range candle buy stops are
taken out second so we have the double
Purge right and then a low resistance
liquidity run should happen to the
downside and we can see that come to
fruition over here so over here we've
got that execution Right double Purge
into the higher time frame key level
with that smt and then execution should
be to the downside and then take profit
below that range low over here so let's
zoom in how it looks like on ES right
this is a 15minute chart so we can
clearly see we have a market maker sell
model going on right we have that
original consolidation down here into
buy side of the curve now that high
probable smart money reversal happens in
a key level with S&T right price starts
to decline and we can see price forms a
range over here so what what does happen
over here first of all purching the sell
stops right it's the same steps over and
over again first the sell stops then
price STS into the buy stops and again
notice how the energetic close below the
lows are right and we can see a Purge on
the high and while the body is closing
below right so we can see it this is
more of a rejection and this is an
indication of bearish order flow so we
got a high probability order block
formed right because we had that double
Purge and we can see that high impact
news comes back into the order block and
then a massive drop occurs down into the
cell side of the curve and completing
that market maker cell model
Browse More Related Video
Secrets of an Order Flow Leg
Intraday Bias Simplified | ICT 2022 Mentorship + MMXM = π€―
Episode 9: Using Standard Deviations Day Trading - ICT Concepts
Perfecting LTF Orderblock Entries With CRT - Candle Range Theory - ICT Concepts
Trading Cepat dan Mudah dengan Market Structure (Detail)
Mastering Order Flow To Make Money Trading (2023)
5.0 / 5 (0 votes)