🔴 (100% SNIPER Entries) - This "MACD-STOCHASTIC-RSI" Strategy Will Make You Filthy RICH
Summary
TLDRThis video teaches a powerful and precise trading strategy using the MACD, Stochastic Oscillator, and RSI indicators to make consistent profits in Forex, stocks, and commodities with minimal risk. The strategy involves combining these indicators to accurately pinpoint high-probability trade signals, confirming trends and market conditions with minimal stop-loss risk. It provides clear instructions on how to configure these tools, enter buy or sell positions, and ensure long-term success. Practical examples and settings for each indicator are also shared to boost your trading accuracy.
Takeaways
- 😀 The combination of MACD, Stochastic Oscillator, and RSI provides a high-probability trading strategy for Forex, stocks, and commodities.
- 😀 The Stochastic Oscillator helps identify overbought and oversold market conditions, with the most accurate setting being a 14-period with levels of 80 (overbought) and 20 (oversold).
- 😀 The RSI (Relative Strength Index) helps confirm short-term trends, with the best setting being an 8-period RSI paired with a 14-period moving average.
- 😀 The MACD (Moving Average Convergence Divergence) helps detect medium-term trends, with a histogram indicating whether the market is bullish or bearish.
- 😀 The key to using these indicators effectively is combining them to create accurate trade signals with minimal stop-loss risk.
- 😀 A Buy signal occurs when the MACD histogram is above the zero line, the Stochastic Oscillator is in the oversold zone, and the RSI crosses above the 14-period moving average.
- 😀 A Sell signal happens when the MACD histogram is below the zero line, the Stochastic Oscillator is in the overbought zone, and the RSI crosses below the 14-period moving average.
- 😀 Risk management is critical, with stop losses set below swing lows for Buy orders and above swing highs for Sell orders to minimize potential losses.
- 😀 The strategy works well across various time frames, but it’s important to check multiple time frames to avoid false signals.
- 😀 By adhering to the rules of this strategy and using the right settings, traders can enhance their chances of long-term success with minimal risk.
Q & A
What is the main strategy taught in this video?
-The main strategy involves combining the MACD, Stochastic Oscillator, and RSI indicators to create a high-probability trading system with minimal stop-loss risk.
Why are the MACD, Stochastic Oscillator, and RSI indicators used together in this strategy?
-These indicators are used together because they complement each other. The Stochastic and RSI help identify overbought or oversold conditions, while the MACD helps determine the medium-term market trend, allowing traders to make more reliable decisions.
What are the key settings for the Stochastic Oscillator in this strategy?
-The key settings for the Stochastic Oscillator are a 14-period setting with overbought at 80 and oversold at 20, which are widely used by professional traders.
How is the RSI used in this strategy?
-The RSI is used to confirm the trend identified by the Stochastic Oscillator. An 8-period RSI is paired with a 14-period moving average to track short-term price movements and confirm bullish or bearish trends.
How can you confirm a bullish trend using this strategy?
-A bullish trend is confirmed when the MACD histogram is above zero, the Stochastic Oscillator is in the oversold region and begins moving above the 20 level, and the RSI line crosses above the 14-period moving average.
What does the MACD histogram represent, and how does it fit into this strategy?
-The MACD histogram represents the difference between two moving averages. If the histogram is above the zero line, it indicates a bullish trend, while a histogram below the zero line suggests a bearish trend. It’s used to confirm the medium-term market direction in this strategy.
What should a trader do if the MACD histogram is above zero, but the Stochastic Oscillator is still oversold?
-The trader should wait for the Stochastic Oscillator to move out of the oversold region (above 20) and then confirm the bullish signal with the RSI crossing above the 14-period moving average before entering a buy position.
How do you enter a sell position in this strategy?
-To enter a sell position, check if the MACD histogram is below zero, indicating a bearish trend. Then, ensure that the Stochastic Oscillator is in the overbought region and begins to move below the 80 level. Finally, the RSI should cross below the 14-period moving average.
What role do stop losses play in this strategy?
-Stop losses are placed just below the nearest swing low for buy positions and just above the nearest swing high for sell positions to limit losses in case the market moves against the trade.
Can this strategy be used on any time frame and market?
-Yes, this strategy is designed to be effective across all time frames and markets, including Forex, stocks, and commodities, as long as the indicators are set correctly.
Outlines

This section is available to paid users only. Please upgrade to access this part.
Upgrade NowMindmap

This section is available to paid users only. Please upgrade to access this part.
Upgrade NowKeywords

This section is available to paid users only. Please upgrade to access this part.
Upgrade NowHighlights

This section is available to paid users only. Please upgrade to access this part.
Upgrade NowTranscripts

This section is available to paid users only. Please upgrade to access this part.
Upgrade NowBrowse More Related Video

It's Impossible to Lose with THIS Strategy! It Almost Always Wins!

🔴 (98% WINRATE STRATEGY) Combines 3 Important Tools: The MACD, Stochastic Oscillator, and RSI

How To Trade Smart Money Concepts | LuxAlgo Full 2025 Updated Guide and Trading Strategy

POCKET OPTION 2024 | HOW I EARN +$2,783 IN 10 MINUTES WITH MY SECRET STRATEGY
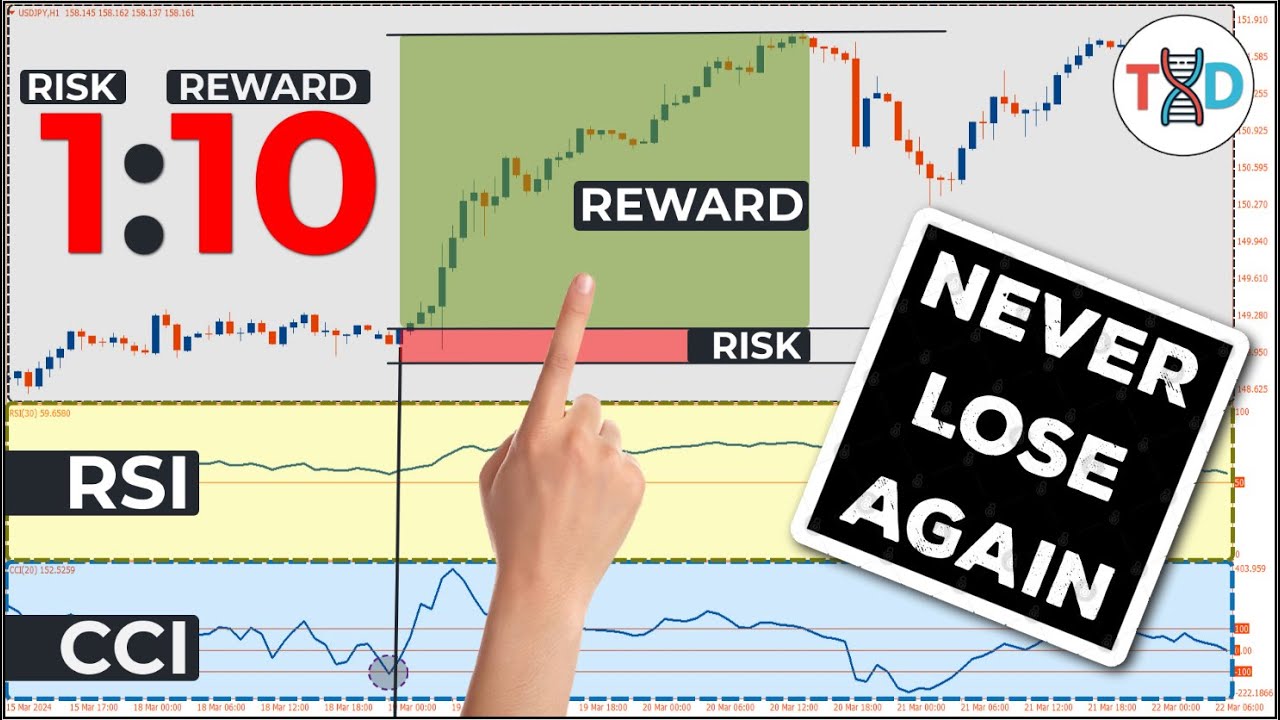
🔴 [1:10] Risk Reward Ratio RSI-CCI Trading (You'll Never Lose Again)
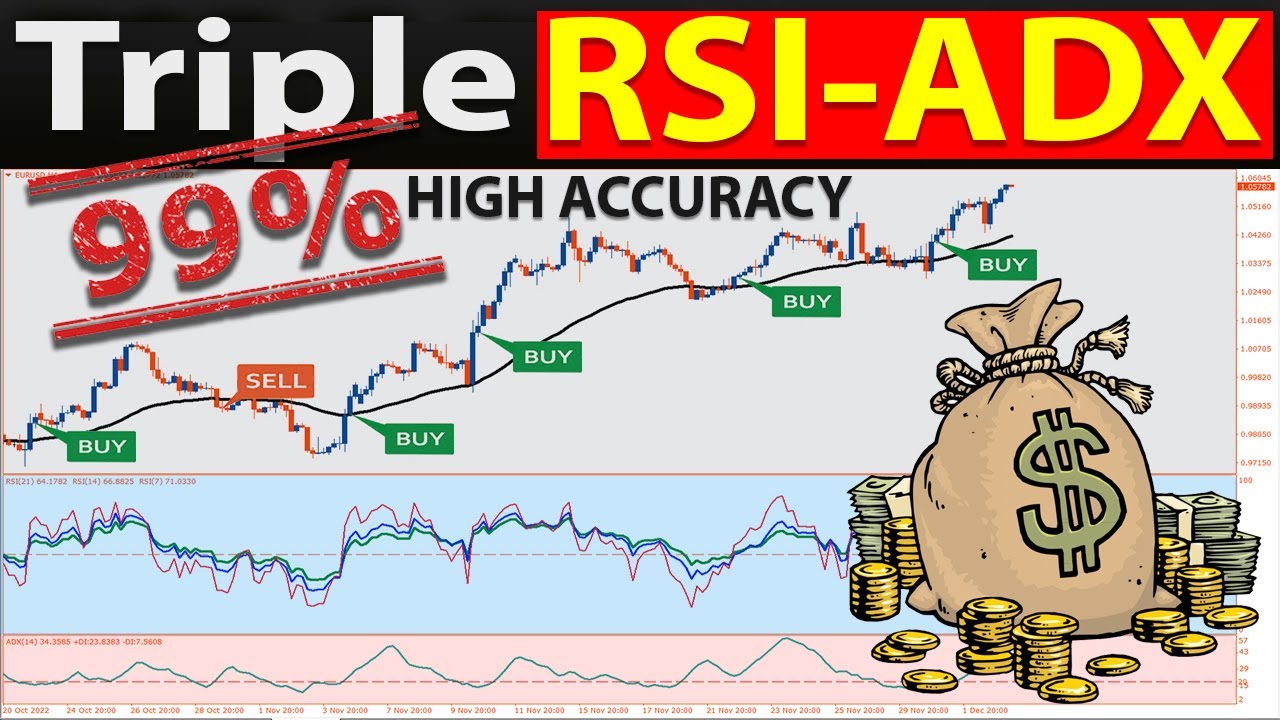
🔴 Triple RSI-ADX Trading Strategy - The BEST "SCALPING and SWING Trading Strategy" for Beginners
5.0 / 5 (0 votes)