Does ICT Work on Crypto? Unveiling the Surprising Truth!
Summary
TLDRThis video script discusses the application of ICT Concepts in crypto trading, emphasizing the importance of using higher time frames to filter noise and improve trading outcomes. The speaker, a professional trader, shares insights on leveraging weekly and daily charts for bias, the significance of market structure shifts, and the power of three pattern for accumulation, manipulation, and distribution. The script also highlights the role of patience and the impact of correlations with stock markets on crypto trends, advocating for a passive income approach to trading.
Takeaways
- 😀 The speaker emphasizes the effectiveness of using ICT (In The Chat) Concepts for crypto trading, despite not personally trading crypto.
- 📈 The importance of applying ICT Concepts correctly to avoid wasted time, stress, and lost trades is highlighted.
- 👨🏫 The speaker, a professional prop trader with three years of experience, shares insights and tools for successfully applying ICT to crypto trading.
- 🕰 The focus is on using higher time frames for crypto trading due to its volatility, with a preference for weekly, daily, 4-hour, 1-hour, and 15-minute charts.
- 📊 The speaker advises against using lower than 15-minute (M15) charts for crypto to avoid noise and market chatter.
- 📉 The strategy involves identifying market structure shifts and premium pricing to build bias and confidence in trades.
- 🔄 The significance of recognizing correlations between the stock market and crypto market is discussed to inform trading bias.
- 📌 The use of SMT (Smart Money Tracker) divergence on higher time frames like daily for Bitcoin and Ethereum is recommended to spot manipulation.
- 📝 The speaker outlines a step-by-step approach to identifying bias, entry points, and executing trades using higher time frame charts.
- 💡 The concept of 'Power of Three' (accumulation, manipulation, distribution) is introduced as a key model for executing trades effectively.
- 🚫 A reminder that patience is crucial in swing trading, as trades can take days or weeks to play out, contrasting with the need for constant attention in day trading.
Q & A
What is the main topic discussed in the video script?
-The main topic discussed in the video script is the application of ICT (In The Chat) Concepts to crypto trading, including strategies for using time frames, correlations, and entry models to successfully trade in the crypto market.
Why does the speaker suggest not to trade on lower time frames like the one-minute chart in crypto?
-The speaker suggests avoiding lower time frames like the one-minute chart in crypto due to the high level of noise and volatility, which can lead to more stress, wasted time, and lost trades.
What are the preferred time frames for the speaker when trading crypto?
-The speaker's preferred time frames for trading crypto are the weekly, daily, 4-hour, 1-hour, and 15-minute (M15) charts, avoiding anything lower than M15.
How does the speaker use the weekly chart in their trading strategy?
-The speaker uses the weekly chart to look for displacement and to determine the range they are operating within, which helps in identifying the market structure and potential trading opportunities.
What role do correlations play in the speaker's crypto trading strategy?
-Correlations play a significant role as the speaker suggests paying attention to the stock market's direction because it often influences the crypto market. This helps in building bias and confidence within trades.
What is the 'Power of Three' accumulation manipulation distribution model mentioned in the script?
-The 'Power of Three' accumulation manipulation distribution model refers to a trading setup where there is a clear accumulation phase, a manipulation event (often triggered by news), and then a distribution or expansion phase, which can indicate potential entry points for trades.
Why is patience important in the speaker's trading strategy?
-Patience is important because the speaker's strategy involves swing trading, which means holding trades for days or weeks. Waiting for the right entry points and letting trades play out over time is crucial for achieving the desired risk-reward ratio.
What does the speaker mean by 'if you can't see the liquidity, then you are the liquidity'?
-This statement implies that if a trader cannot identify the points of liquidity or market structure shifts, they may end up being the ones providing liquidity by entering trades at less optimal points, potentially leading to losses.
How does the speaker use the daily chart in their trading strategy?
-The speaker uses the daily chart to refine entry points and to confirm biases built from the weekly chart. It helps in identifying market structure shifts and potential areas for taking liquidity.
What is the significance of 'stop hunting' mentioned in the script?
-Stop hunting refers to a situation where the market appears to move in a particular direction just enough to trigger stop-loss orders before reversing, causing traders to exit their positions at unfavorable times. The speaker's strategy aims to avoid such situations by using higher time frames and proper bias identification.
How does the speaker approach risk-reward ratio in their trades?
-The speaker emphasizes looking for trades with a risk-reward ratio of at least 2:1, which helps in managing losses and increasing the win rate, especially when using higher time frames to filter out market noise.
Outlines

This section is available to paid users only. Please upgrade to access this part.
Upgrade NowMindmap

This section is available to paid users only. Please upgrade to access this part.
Upgrade NowKeywords

This section is available to paid users only. Please upgrade to access this part.
Upgrade NowHighlights

This section is available to paid users only. Please upgrade to access this part.
Upgrade NowTranscripts

This section is available to paid users only. Please upgrade to access this part.
Upgrade NowBrowse More Related Video

How to Use ICT HTF Bias

Kenapa Scalping di H1 dan H4 Lebih Menguntungkan? Ini Jawabannya!
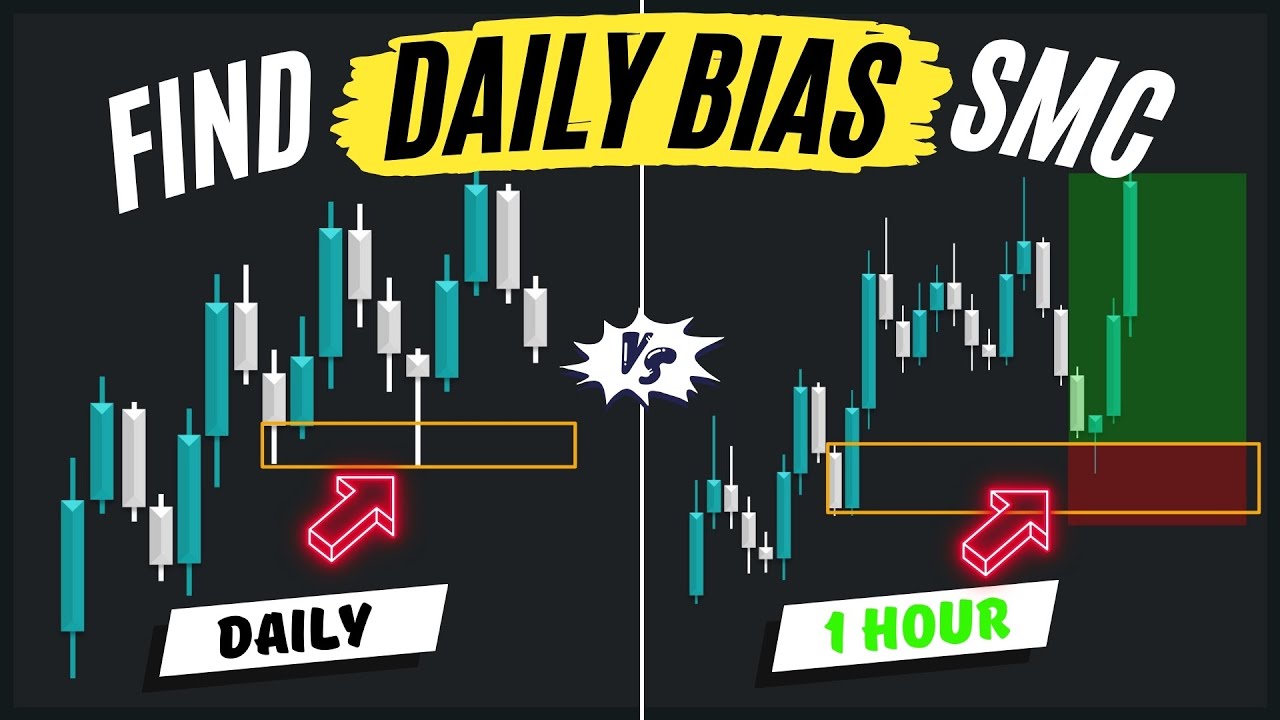
Best Daily Bias Trading Strategy SMC

The Key To Understanding Market Structure Shifts (MSS) 🔥 - ICT 2022 Mentorship
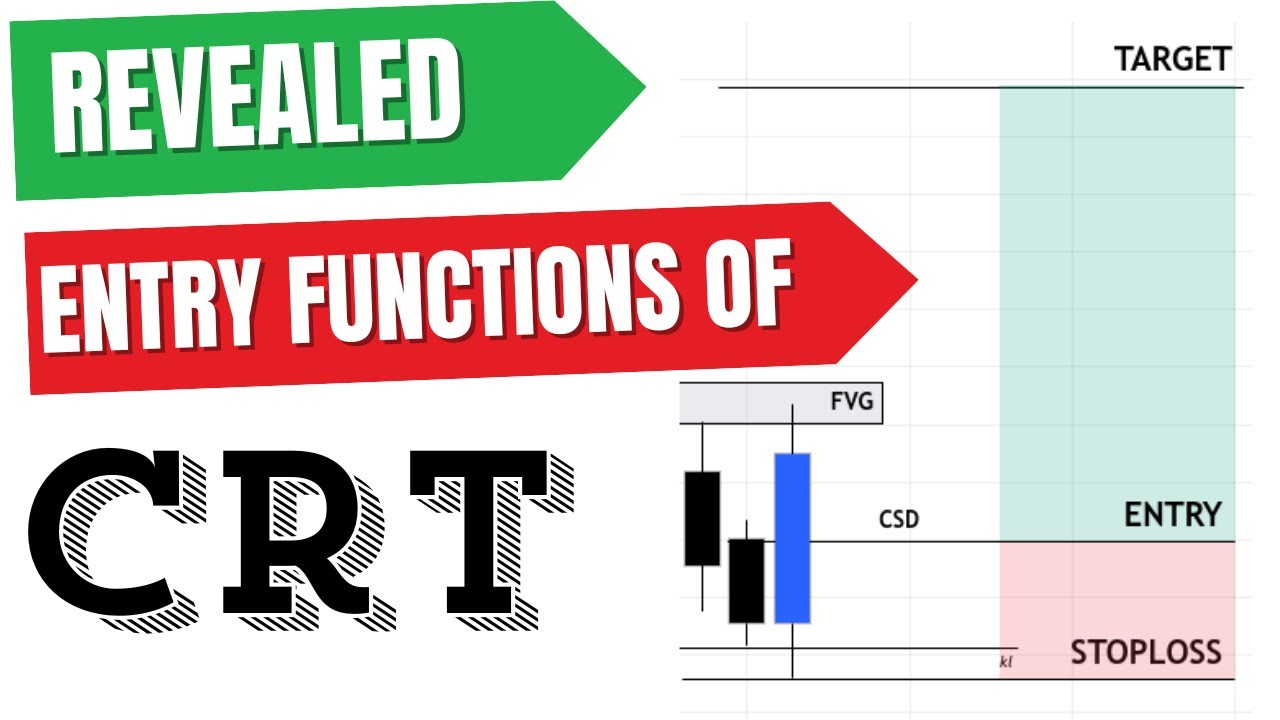
REVEALED ENTRY FUNCTIONS OF CRT | TURTLE SOUP

FREE ICT Indicator That Validates Smart Money Concepts AUTOMATICALLY (Open Source)
5.0 / 5 (0 votes)