ULANGAN HARIAN STATISTIKA Pemusatan dan Penyebaran Data
Summary
TLDRThis video from 'Matematika Hebat' provides a comprehensive guide on basic statistics for middle school students, focusing on measures of central tendency and data dispersion. The instructor walks viewers step-by-step through calculating mean, median, mode, range, quartiles, and interquartile range, including examples with individual numbers and frequency tables. Each problem is explained clearly with practical tips for easy computation, ensuring students understand both the concept and method. The tutorial also covers finding values above the mean and adjusting averages with additional data, making it a thorough, engaging, and accessible resource for mastering daily statistics exercises.
Takeaways
- 😀 The video teaches about statistics for middle school students, focusing on measures of central tendency and data dispersion.
- 😀 To calculate the mean of a data set, sum all the values and divide by the total number of values.
- 😀 Solving for an unknown in a mean calculation involves setting up an equation using the known mean and total number of values.
- 😀 The mode of a data set is the value(s) that appear most frequently; there can be more than one mode.
- 😀 The median is the middle value of a sorted data set; for even-numbered sets, it is the average of the two middle values.
- 😀 The range of a data set is calculated by subtracting the smallest value from the largest value.
- 😀 When calculating the mean from a frequency table, multiply each value by its frequency, sum the results, and divide by the total frequency.
- 😀 To determine how many students scored above the mean, calculate the mean first, then count the number of values above it.
- 😀 When a new value is added to a data set, the new mean can be used to find the added value using the total sum and the number of items.
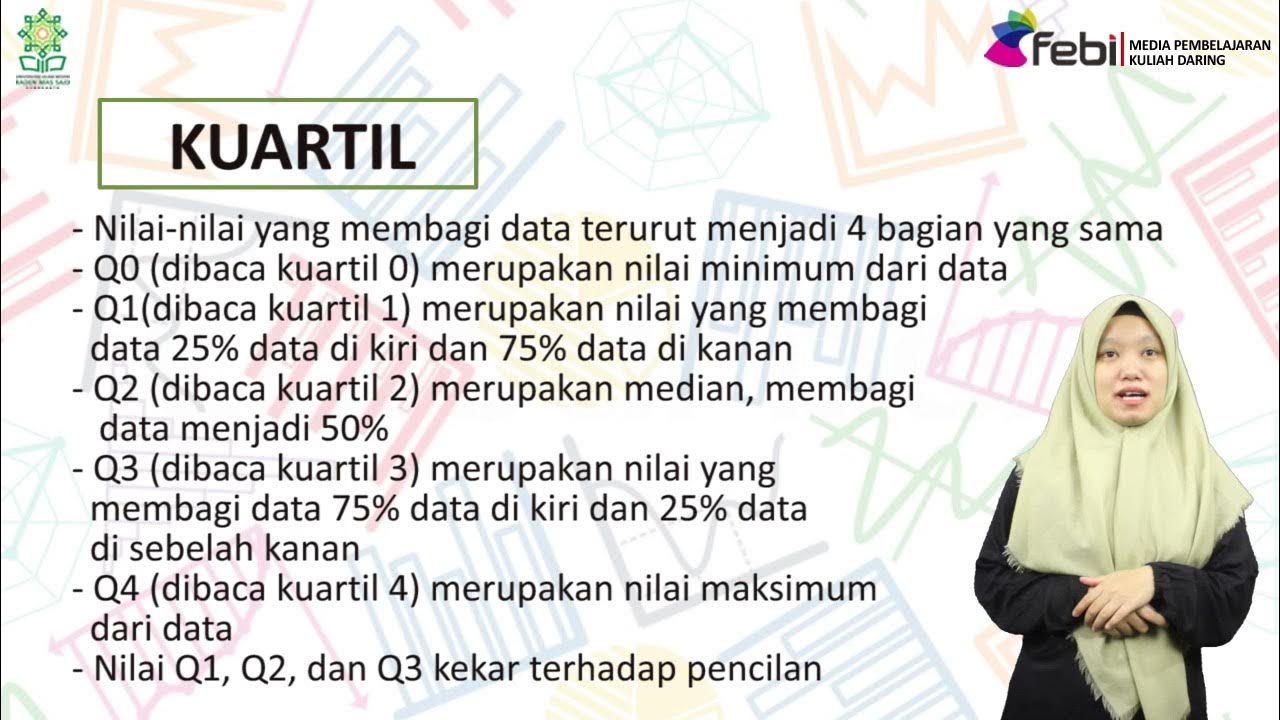
- 😀 Quartiles divide a data set into four equal parts; the lower quartile (Q1) and upper quartile (Q3) are used to calculate the interquartile range or quartile deviation.
- 😀 Quartile deviation (QD) is half the difference between the upper quartile (Q3) and lower quartile (Q1) and measures data dispersion.
Q & A
What is the formula for calculating the mean (average) of a data set?
-The mean is calculated by summing all the data values and dividing by the total number of values. Mathematically, it is expressed as X̄ = (ΣX) / n, where ΣX is the sum of all values and n is the number of values.
How do you determine the value of x if the mean of a data set is already known?
-To find x, multiply the known mean by the total number of data points to get the total sum, then subtract the sum of the other known data points. For example, if the mean is 10 for {7, 5, 13, x, 9}, calculate 10 × 5 = 50, subtract the sum of 7 + 5 + 13 + 9 = 34, which gives x = 16.
What is the definition of the mode in a data set?
-The mode is the value that occurs most frequently in a data set. A data set can have one mode, more than one mode, or no mode at all if all values occur with the same frequency.
What is the method to find the median of a data set?
-First, arrange the data in ascending order. If the number of data points is odd, the median is the middle value. If the number of data points is even, the median is the average of the two middle values.
How is the range (jangkauan) of a data set calculated?
-The range is the difference between the largest and smallest values in the data set. Formula: Range = Xmax − Xmin.
How do you calculate the mean from a frequency table?
-Multiply each value by its frequency, sum all the products, and then divide by the total frequency. Formula: X̄ = Σ(f × X) / Σf, where f is the frequency and X is the value.
How can you find the number of students scoring above the mean from a frequency table?
-First, calculate the mean using the frequency table. Then, identify all values greater than the mean and sum their corresponding frequencies. This gives the number of students scoring above the mean.
How do you determine the individual score needed to raise the mean when adding a new data point?
-Multiply the original mean by the original number of data points to get the total sum. Multiply the new mean by the new total number of data points. Subtract the original total from the new total to find the new data point's value.
What are Q1 and Q3 in a data set, and how are they found?
-Q1 (lower quartile) is the median of the lower half of the data, and Q3 (upper quartile) is the median of the upper half. First, sort the data in ascending order, then divide it into two halves. Find the median of each half to get Q1 and Q3.
How is the quartile deviation (simpangan kuartil) calculated?
-The quartile deviation is half the difference between the upper quartile (Q3) and the lower quartile (Q1). Formula: QD = (Q3 − Q1) / 2.
Outlines

This section is available to paid users only. Please upgrade to access this part.
Upgrade NowMindmap

This section is available to paid users only. Please upgrade to access this part.
Upgrade NowKeywords

This section is available to paid users only. Please upgrade to access this part.
Upgrade NowHighlights

This section is available to paid users only. Please upgrade to access this part.
Upgrade NowTranscripts

This section is available to paid users only. Please upgrade to access this part.
Upgrade NowBrowse More Related Video

Statistika 1 ~ Ukuran Pemusatan Data (Mean/Rata-Rata, Median, Modus) ~ Materi PJJ Kelas VIII / 8 SMP
Statistika Deskriptif Ukuran Pemusatan dan Penyebaran Data | Zulfanita Dien Rizqiana, S.Stat., M.Si.
Statistika - Ukuran Pemusatan Data (Mean, Median, Modus)

Descriptive Statistics [Simply explained]

Ukuran Dispersi dan Variasi

ETC1000 Topic 2a
5.0 / 5 (0 votes)