Data dan Diagram "Investigasi Statistika"
Summary
TLDRIn this lesson, students are introduced to the basics of statistics, focusing on data collection, analysis, and interpretation. The teacher explains key concepts such as formulating statistical questions, gathering data through methods like surveys and observation, and presenting data using various types of diagrams, including bar charts and line plots. The goal is for students to understand how to apply statistical methods to real-world problems, including creating hypotheses, collecting relevant data, and making conclusions based on analysis. The session ends with a call for students to practice these skills through a class exercise.
Takeaways
- 😀 The lesson begins with a greeting and a prayer, emphasizing respect and mindfulness before starting mathematics.
- 😀 The new topic covered is statistics, focusing on data and diagrams within a mathematics context.
- 😀 Statistics involves collecting, organizing, displaying, analyzing, and interpreting numerical data.
- 😀 Data can be categorized into two types: categorical and numerical.
- 😀 Diagrams for presenting data include bar charts, line charts, and pie charts.
- 😀 The learning objectives include formulating statistical questions, collecting data, analyzing it, and interpreting the results.
- 😀 Pictograms and bar charts are both effective ways to visualize data, with each icon or bar representing quantities.
- 😀 The statistical investigation process involves four steps: formulating questions, collecting data, analyzing data, and interpreting results.
- 😀 Methods of data collection include observation, interviews, questionnaires, measurements, and literature studies.
- 😀 Analysis tools like line plots help in summarizing and interpreting data, such as identifying the most common or longest names in a class.
- 😀 Example exercises encourage students to practice by creating statistical questions, collecting data, analyzing it, and interpreting the results.
- 😀 The lesson concludes with a summary, emphasizing that statistical questions should be objective and specific, followed by a closing prayer.
Q & A
What is the main topic of today's lesson?
-The main topic of today's lesson is statistics, specifically data and diagrams, which includes the subtopic of mathematical investigations.
What does 'statistika' (statistics) refer to in mathematics?
-'Statistika' refers to a branch of mathematics that involves the collection, organization, presentation, analysis, and interpretation of data, usually in numerical form.
How is data divided in statistical investigations?
-Data in statistics is divided into two types: categorical data and numerical data. Diagrams are further categorized into bar diagrams, line graphs, and pie charts.
What is the purpose of the piktogram (pictogram) and diagram batang (bar chart) shown in the lesson?
-Both the pictogram and the bar chart serve to present data in an understandable manner, though they use different visual formats. The pictogram uses icons or images, while the bar chart uses bars to represent data.
What are the main steps in conducting a statistical investigation?
-The steps include formulating an investigation question, collecting data, analyzing the data, and interpreting the results based on the investigation.
How can data be collected in statistical investigations?
-Data can be collected in various ways: through observation, interviews, surveys (questionnaires), measurement, and reviewing literature related to the topic being researched.
What is the purpose of a line plot in data analysis?
-A line plot is used to display data points along a number line, helping to visually analyze patterns or trends in the data, such as the frequency of certain values.
What is meant by 'interpretation of results' in a statistical investigation?
-Interpretation of results involves drawing conclusions based on the data analysis, such as identifying trends, comparing groups, or answering the initial research question.
How can a statistical investigation be used to answer questions about students' names?
-An example of a statistical investigation might involve collecting data on the number of letters in students' names, analyzing this data, and determining which name has the most letters.
What was one of the example questions given for a statistical investigation in the script?
-One example question for a statistical investigation was: 'How many letters are in each student's name in your class?'
Outlines

This section is available to paid users only. Please upgrade to access this part.
Upgrade NowMindmap

This section is available to paid users only. Please upgrade to access this part.
Upgrade NowKeywords

This section is available to paid users only. Please upgrade to access this part.
Upgrade NowHighlights

This section is available to paid users only. Please upgrade to access this part.
Upgrade NowTranscripts

This section is available to paid users only. Please upgrade to access this part.
Upgrade NowBrowse More Related Video

ANALISIS DATA KELAS 8 SMP

SEB1 Pengantar Statistika / Konsep Dasar Statistika - Statistika Ekonomi dan Bisnis bab 1 (Part 1)
Berkenalan dengan Statistika

Aula 01 - Parte 1
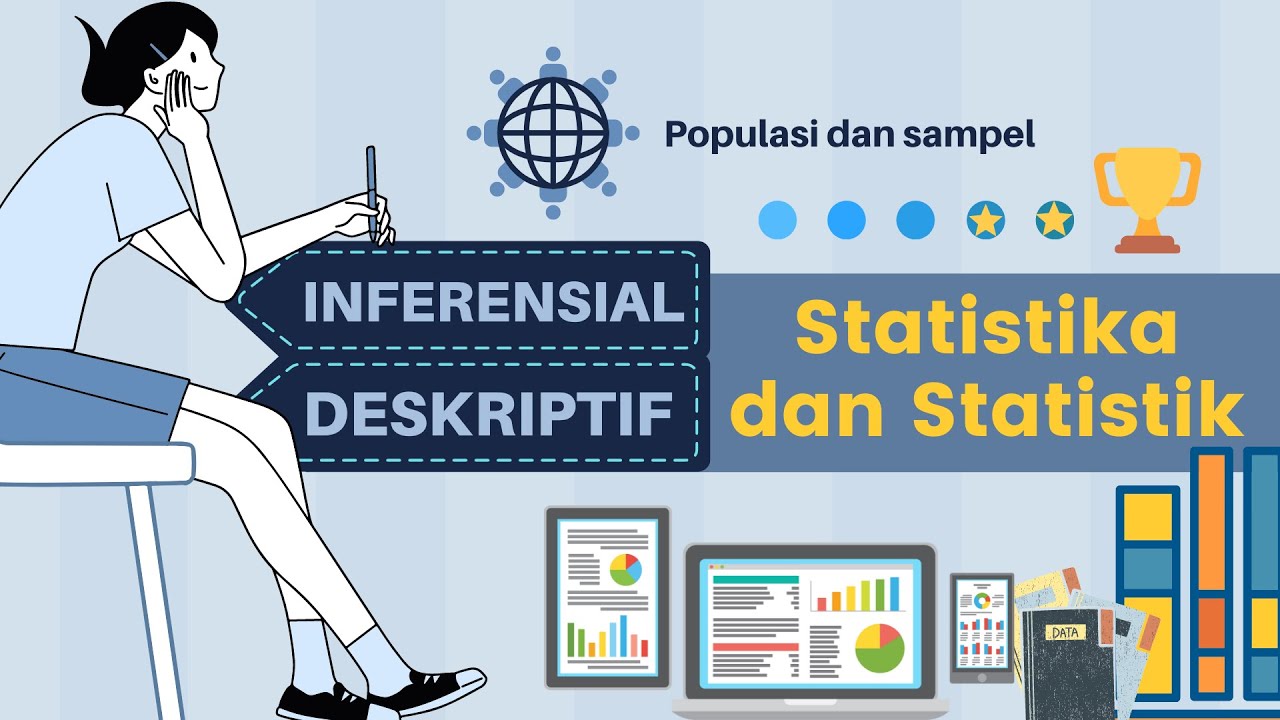
PERBEDAAN STATISTIK DESKRIPTIF DAN INFERENSIAL

Tutorial Lengkap mengolah data penelitian eksperimen menggunakan SPSS # PENELITIAN EKSPERIMEN PART 1
5.0 / 5 (0 votes)