Tutorial Lengkap mengolah data penelitian eksperimen menggunakan SPSS # PENELITIAN EKSPERIMEN PART 1
Summary
TLDRThis video tutorial provides a comprehensive guide to data processing in research, focusing on quantitative methods and experimental design. It explains how to set up a pretest-posttest control group design to compare the effects of Problem-Based Learning (PBL) versus conventional teaching methods. The tutorial covers data collection, setting up Excel for analysis, calculating improvements between pretest and posttest scores, and using both descriptive and inferential statistics. SPSS and Excel are introduced as key tools for analyzing data, making the process accessible for students and researchers looking to handle research data efficiently.
Takeaways
- 😀 Understand the importance of data processing in research and how it helps in answering research questions.
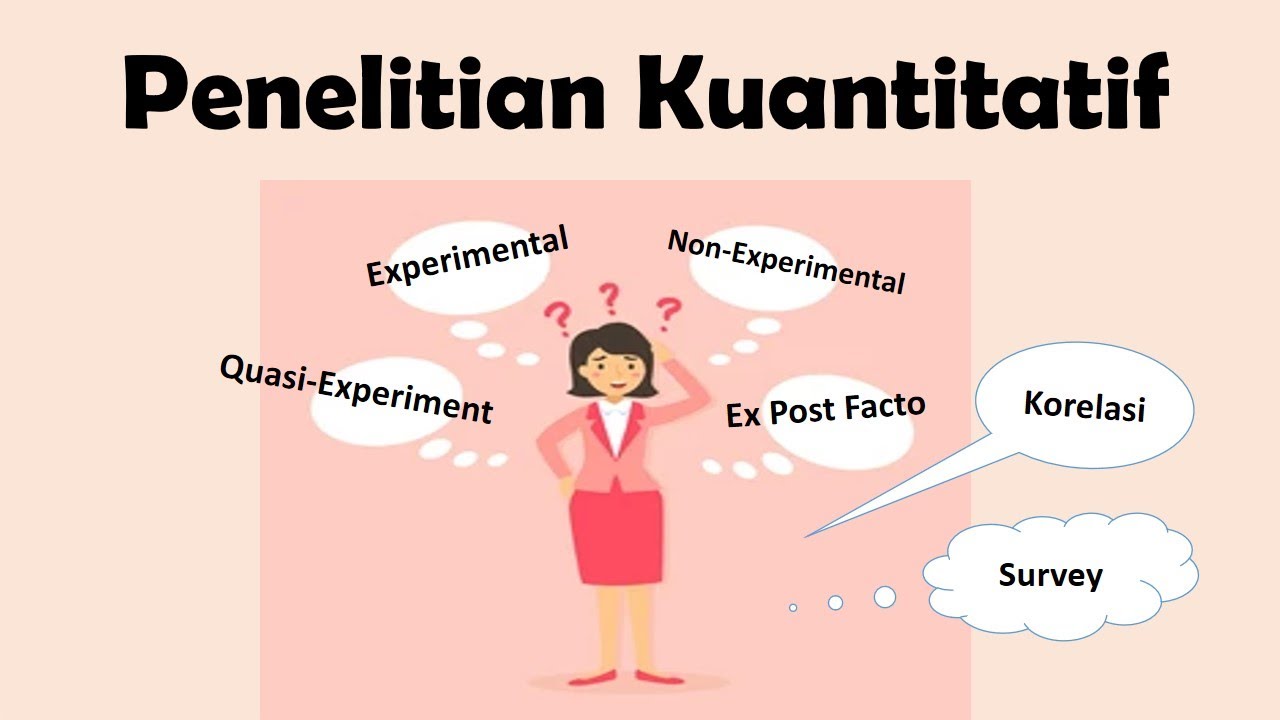
- 😀 The video focuses on quantitative research and how to handle data specifically in quasi-experimental designs.
- 😀 The script explains the process of analyzing research data using pretest and posttest results from both experimental and control groups.
- 😀 A clear distinction is made between 'PBL' (Problem-Based Learning) and 'conventional' teaching methods, which are compared in the study.
- 😀 The importance of defining the research question, such as whether there is a difference in science literacy between the two teaching methods.
- 😀 Research design is explained using a 'pretest-posttest control group' method, involving two classes: one using PBL and the other using conventional methods.
- 😀 The methodology section outlines the population, sample, and sampling technique, which includes the use of 'cluster random sampling'.
- 😀 Descriptive statistics such as mean, median, and mode are used for initial data analysis, while inferential statistics are employed for hypothesis testing.
- 😀 The analysis tools mentioned include Microsoft Excel and SPSS, which are used to process the collected data and perform statistical tests.
- 😀 The video provides a step-by-step guide for organizing and analyzing data in Excel, including calculating improvements between pretest and posttest scores.
- 😀 The script emphasizes fairness in the data analysis process, especially when pretest scores differ significantly between experimental and control groups.
Q & A
What is the main focus of the video script?
-The video script focuses on explaining the process of data analysis in educational research, particularly in quantitative research methods involving pretest and posttest designs. It discusses how to analyze research data using tools like Microsoft Excel and SPSS, and provides a step-by-step guide for handling and interpreting research results.
What is the research design used in the example provided?
-The research design discussed in the example is the pretest-posttest control group design, which involves two classes: an experimental group receiving the Problem-Based Learning (PBL) model and a control group receiving conventional teaching methods. Both groups undergo a pretest and posttest to measure the impact of the intervention.
What is the significance of the pretest in this research design?
-The pretest is important because it helps to assess the baseline knowledge or skill level of the students in both the experimental and control groups before the intervention. It ensures that any differences observed in the posttest results can be attributed to the teaching methods rather than pre-existing differences.
How is the difference between the experimental and control groups measured?
-The difference between the experimental and control groups is measured by comparing the pretest and posttest scores. The script emphasizes calculating the improvement (or 'change') between the two tests to assess the impact of the intervention (PBL) in the experimental group versus the conventional teaching method in the control group.
Why is the use of improvement calculation (posttest - pretest) emphasized?
-The calculation of improvement (posttest - pretest) is emphasized because it helps determine the effect of the intervention. If the pretest scores of the two groups are significantly different, using the posttest scores directly could lead to biased conclusions. By calculating the improvement, researchers can more fairly compare the effectiveness of the two teaching methods.
What statistical methods are used to analyze the data?
-The script outlines the use of both descriptive and inferential statistics to analyze the data. Descriptive statistics, such as mean, median, and mode, are used to summarize the data, while inferential statistics are applied to test hypotheses and determine if there are significant differences between the groups.
What tools are recommended for data analysis?
-The script recommends using Microsoft Excel and SPSS for data analysis. Microsoft Excel is used to organize and tabulate the data, while SPSS is suggested for more advanced statistical analysis, such as hypothesis testing.
What is the role of 'Cluster Random Sampling' in the research design?
-Cluster random sampling is used to select the sample groups from the population. In the context of this research, instead of randomly selecting individual students, entire classes (or clusters) are randomly assigned to the experimental or control group. This is a common approach in educational research where manipulating individual students is not feasible.
What is the research problem being addressed in this script?
-The research problem addressed is whether there is a significant difference in science literacy between students who receive Problem-Based Learning (PBL) and those who receive conventional teaching methods. This is explored by comparing pretest and posttest scores from both groups.
How does the script explain handling potential pretest differences between the groups?
-If the pretest scores between the experimental and control groups are significantly different, the script suggests calculating the improvement scores to ensure a fair comparison. If there are no significant differences in pretest scores, the posttest scores can be used directly to assess the impact of the teaching methods.
Outlines

This section is available to paid users only. Please upgrade to access this part.
Upgrade NowMindmap

This section is available to paid users only. Please upgrade to access this part.
Upgrade NowKeywords

This section is available to paid users only. Please upgrade to access this part.
Upgrade NowHighlights

This section is available to paid users only. Please upgrade to access this part.
Upgrade NowTranscripts

This section is available to paid users only. Please upgrade to access this part.
Upgrade NowBrowse More Related Video


5.0 / 5 (0 votes)