mql5 Pivot Point Coding Tutorial For Metatrader 5
Summary
TLDRIn this tutorial, the process of creating an Expert Advisor (EA) in MetaTrader 5 to draw pivot points, as well as support and resistance levels, is demonstrated. The script calculates the high, low, and close prices from the previous day's bar to compute the pivot point and the corresponding resistance (R1, R2) and support (S1, S2) levels. By using MQL5 functions, the lines are drawn on the chart, with the ability to customize colors and sizes. The tutorial also highlights how functions can clean up code and enhance reusability, making the script more efficient for future modifications.
Takeaways
- 😀 The video explains how to calculate and draw pivot points, support, and resistance levels in MetaTrader using MQL5.
- 😀 The main objective is to draw horizontal lines at specific levels on the chart for trading or analysis purposes.
- 😀 The process begins by creating a new Expert Advisor or indicator in MetaTrader, which will run the code for drawing the lines.
- 😀 To calculate pivot points, the script uses the previous day's high, low, and close prices, which are gathered using built-in MQL5 functions like `iHigh`, `iLow`, and `iClose`.
- 😀 The pivot point is calculated by averaging the high, low, and close prices from the previous day.
- 😀 Objects in MetaTrader, such as lines, are drawn by assigning unique names to each object, which is critical for managing multiple lines on a chart.
- 😀 The script uses the `ObjectDelete` and `ObjectCreate` functions to remove any existing lines with the same name and create new ones based on the calculated levels.
- 😀 MQL5 allows users to modify properties of the objects (like line color and thickness) using `ObjectSetInteger` and other similar functions.
- 😀 Functions in the script (like `createLine`) are introduced to avoid repeating code, making it more efficient and readable.
- 😀 The tutorial provides a hands-on approach to coding pivot point lines, encouraging users to customize the script further, including adding additional support/resistance levels or implementing trading strategies like trailing stops.
Q & A
What is the purpose of calculating pivot points in the context of automated trading?
-Pivot points are key levels used by traders to identify potential price levels where the market may reverse direction. In this tutorial, the pivot points are calculated and drawn on the chart to assist with trading decisions, such as identifying support and resistance levels.
How does the MQL5 language help in calculating pivot points?
-MQL5 provides functions like `iHigh()`, `iLow()`, and `iClose()` to retrieve the high, low, and close prices of the previous daily bar. These values are used to calculate the pivot point using the formula: (High + Low + Close) / 3.
What is the significance of the `onTick()` function in this Expert Advisor?
-The `onTick()` function is the main event handler in MQL5 that is executed every time the market price updates. In this tutorial, it is used to run the code that calculates and draws the pivot point and support/resistance lines whenever a new price tick occurs.
Why is it important to have unique names for chart objects in MetaTrader?
-Each chart object (like a line or shape) in MetaTrader must have a unique name to differentiate it from others. This is essential for object manipulation, such as deleting or modifying existing objects, as the system uses these names to identify them.
How can you modify the appearance of the pivot point line once it is created?
-The appearance of the pivot point line can be modified using the `ObjectSetInteger()` function. For example, the color of the line can be changed by setting the `object_prop_color` property to a desired color (like `medium blue`). You can also adjust the line's width using `ObjectSetInteger()` for properties like `object_prop_width`.
What is the formula for calculating the first resistance level (R1)?
-The first resistance level (R1) is calculated by the formula: Pivot Point * 2 - Low. This gives an estimate of a potential resistance area above the pivot point.
What is the purpose of the `ObjectCreate()` function in the script?
-The `ObjectCreate()` function is used to create an object on the chart, such as a horizontal line, at the specified time and price levels. It requires parameters like chart ID, object name, type of object, and price values to draw the object correctly on the chart.
How can the code be refactored for better efficiency when drawing multiple lines?
-The code can be refactored by creating a reusable function, like `CreateLine()`, that takes parameters for the object name, time, price, and color. This eliminates repetitive code and makes the program more modular, easier to maintain, and less error-prone.
What is the benefit of using functions in this program?
-Using functions in this program makes the code cleaner, more efficient, and easier to manage. It allows you to reuse blocks of code multiple times without repeating the same logic, making the program more readable and easier to debug or update.
What additional feature does the tutorial suggest implementing for further improvement?
-The tutorial suggests adding a third resistance level (R3) and third support level (S3) to the program. This would expand the pivot point system to include additional price levels for traders to consider in their analysis.
Outlines

This section is available to paid users only. Please upgrade to access this part.
Upgrade NowMindmap

This section is available to paid users only. Please upgrade to access this part.
Upgrade NowKeywords

This section is available to paid users only. Please upgrade to access this part.
Upgrade NowHighlights

This section is available to paid users only. Please upgrade to access this part.
Upgrade NowTranscripts

This section is available to paid users only. Please upgrade to access this part.
Upgrade NowBrowse More Related Video
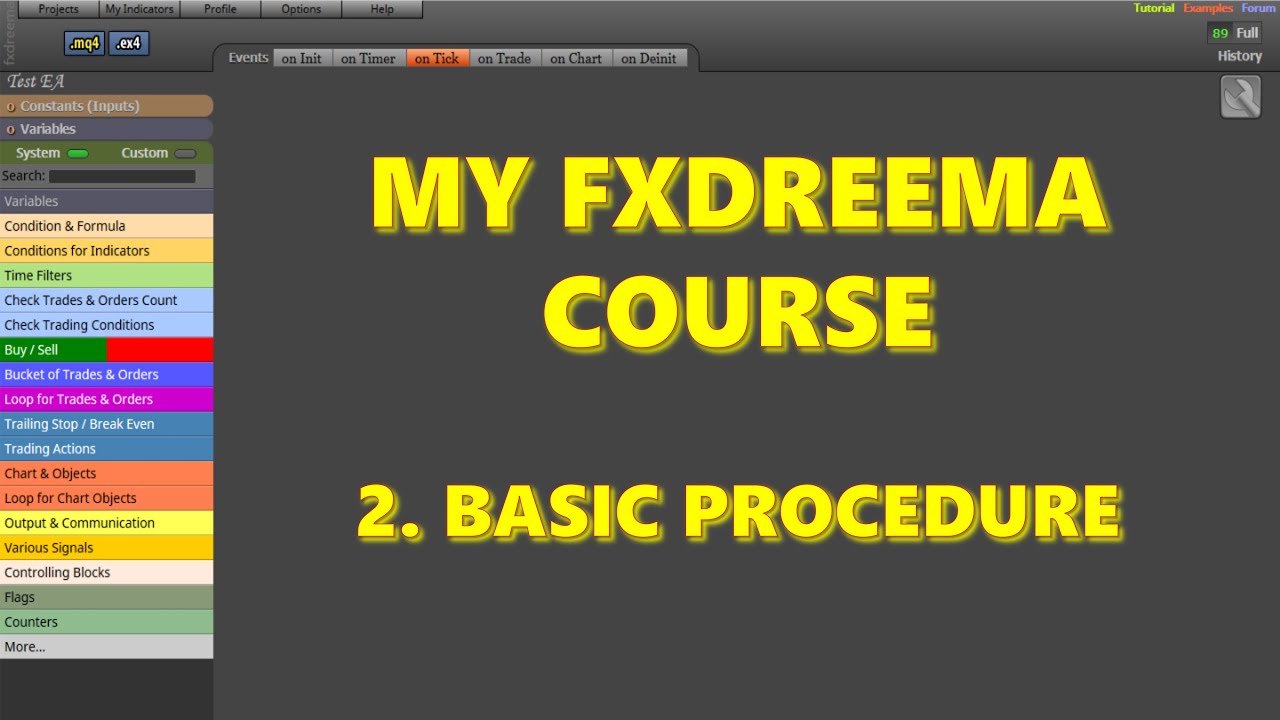
Introductory fxDreema course. Video 2. Basic procedure.

Range Breakout EA mql5 Programming | Part 1/4

How to Backtest Metatrader 5 (MT5) - The Ultimate Guide for 2024

INTRADAY STRATEGY - PIVOT + VWAP + EMA

FULL Code || Forex Trading Robot || 90% WIN (backtest) || Tight StopLoss || (Part 1)

I Let ChatGPT Build MT5 Trading Bots (Step by Step)
5.0 / 5 (0 votes)