Exposing The Truth Behind Time Cycles [Strategy Explained]
Summary
TLDRIn this lecture, the presenter breaks down a market maker S model trade on NASDAQ, explaining the use of time cycles, order flow, and key liquidity levels in execution. The video covers the full trading protocol from higher to lower time frames, showing how price action, including imbalances and cycles, informs both bearish and bullish setups. Key concepts such as market model structures, smart money techniques (SMT), and entry/exit strategies are discussed, offering valuable insights into anticipating reversals and continuations. The main takeaway emphasizes the role of drawn liquidity in determining the market model and execution decisions.
Takeaways
- 😀 Time cycles play a crucial role in understanding market movements, particularly in predicting reversals and continuations based on price behavior.
- 😀 The higher time frame analysis helps establish the overarching narrative, focusing on order flow and price behavior, which determines if the market is bullish or bearish.
- 😀 The market maker S model involves looking for lower retracements followed by expansions, particularly in bearish markets, where price targets sell-side liquidity.
- 😀 Key price levels, such as the previous week's low or the previous day's low, are critical for determining entry and exit points in the trade.
- 😀 Lower time frame confirmation is necessary to validate higher time frame analysis. This includes using small cycle patterns to confirm price movements and market trends.
- 😀 SMT (Smart Money Trap) helps identify the highest probability trade setups by comparing cycles in related instruments like NASDAQ and ES to spot divergences.
- 😀 Understanding price as a 'balanced range' allows for more precise predictions. If a range is balanced, price should be rejected at the boundaries upon returning.
- 😀 The concept of 'draw liquidity' refers to identifying areas where price is likely to move, such as liquidity pools and previous cycle lows or highs.
- 😀 The execution protocol is focused on identifying the best entry points using time cycles and other technical factors, such as price displacement.
- 😀 Having predefined targets (like consolidation levels and liquidity zones) reduces uncertainty, making it easier to hold trades confidently towards completion.
- 😀 Time and price alignment is key to trade confirmation, and using macro windows (like 9:45-10:15) helps validate whether the market will continue or reverse within the expected timeframe.
Q & A
What is the primary concept being explained in this video?
-The primary concept explained is the market maker 'S model' trade, focusing on time cycles, price structure, and liquidity analysis, particularly for NASDAQ.
How does the speaker define 'order flow' and its role in the analysis?
-Order flow refers to the direction in which price is moving, and the speaker uses it to determine whether the market is bullish or bearish. If price remains below a certain imbalance, order flow is considered bearish, indicating a sell program.
What is the significance of the 'imbalance' mentioned in the lecture?
-An imbalance refers to a price level that has been tested multiple times as either support or resistance. If price remains below an imbalance, it signals a bearish order flow, while a displacement above it suggests a bullish shift.
Why is the 'previous week low' considered an important target?
-The previous week low is considered a target because it represents a key liquidity point. In a bearish market, it acts as the draw liquidity that traders aim for as part of the market maker S model.
What is the relationship between higher and lower timeframes in this trading strategy?
-Higher timeframes provide the overall market narrative (such as the direction of order flow), while lower timeframes are used to confirm specific entry points and refine trade execution within the broader context.
What is the 'market maker S model'?
-The market maker S model is a price pattern that involves an expansion lower, followed by a retracement higher, and then another expansion lower. It’s typically used in a bearish market to identify potential sell setups.
How does the speaker incorporate 'time cycles' into their analysis?
-Time cycles are used to track price movements within specific intervals (e.g., 3-minute or 10-minute cycles). A change in the cycle high or low can signal either a continuation or reversal, providing insights into potential price behavior.
What is the significance of 'SMT' and how is it used in the strategy?
-'SMT' refers to Smart Money Technique, a pattern observed when different markets (like NASDAQ and ES) behave differently. A divergence between these markets can indicate a high-probability reversal or continuation signal.
Why is it important to hold trades towards predefined targets?
-Holding trades towards predefined targets is important because it ensures traders remain aligned with their original analysis. Exiting early could lead to giving away profits, especially if the targets are based on solid market structure and liquidity points.
How are entry and invalidation levels determined in this strategy?
-Entry levels are determined when price retraces into key resistance or support levels (such as the previous cycle high). Invalidation levels are placed above or below key points, such as the smart reversal, ensuring the trade remains valid as long as these levels are not breached.
Outlines

This section is available to paid users only. Please upgrade to access this part.
Upgrade NowMindmap

This section is available to paid users only. Please upgrade to access this part.
Upgrade NowKeywords

This section is available to paid users only. Please upgrade to access this part.
Upgrade NowHighlights

This section is available to paid users only. Please upgrade to access this part.
Upgrade NowTranscripts

This section is available to paid users only. Please upgrade to access this part.
Upgrade NowBrowse More Related Video
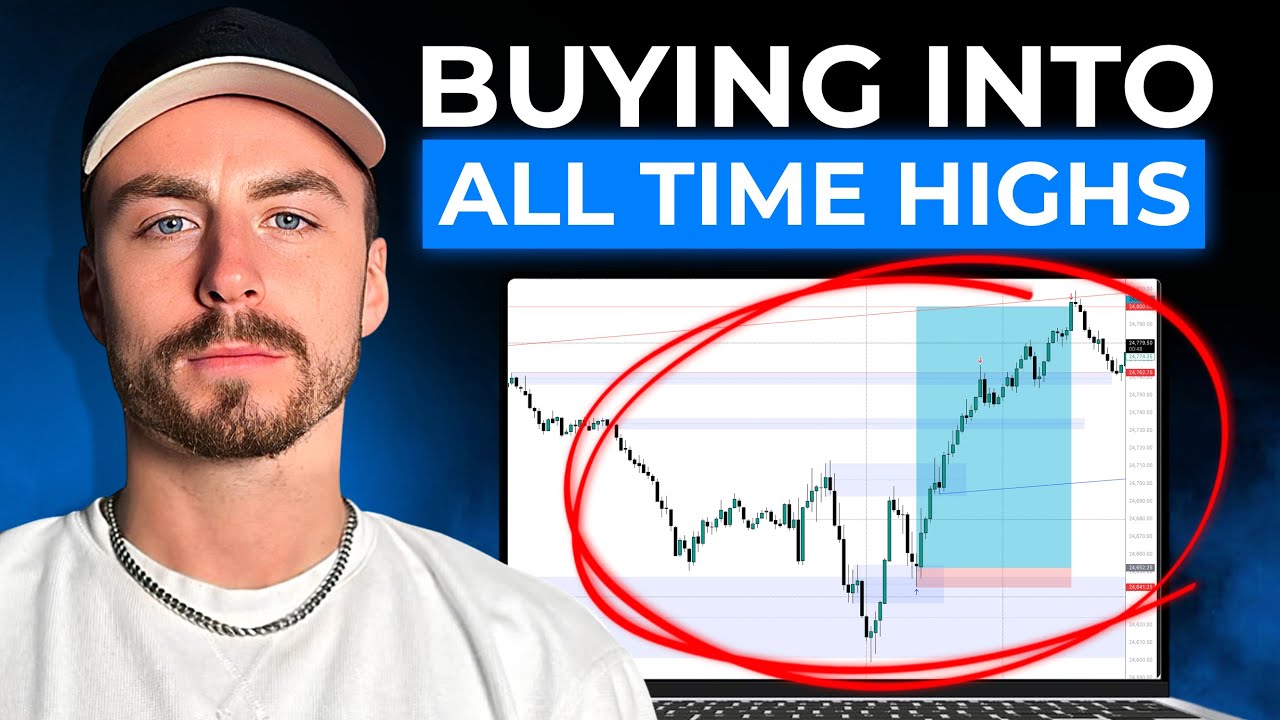
Buying Into All Time Highs On Nasdaq [Trade Breakdown]

Trading Against Order Flow Using MMSM (Trade Breakdown)

How To Use Balanced Price Range with IPDA Times

How To Spot the Bottom of ICT's Market Maker Model
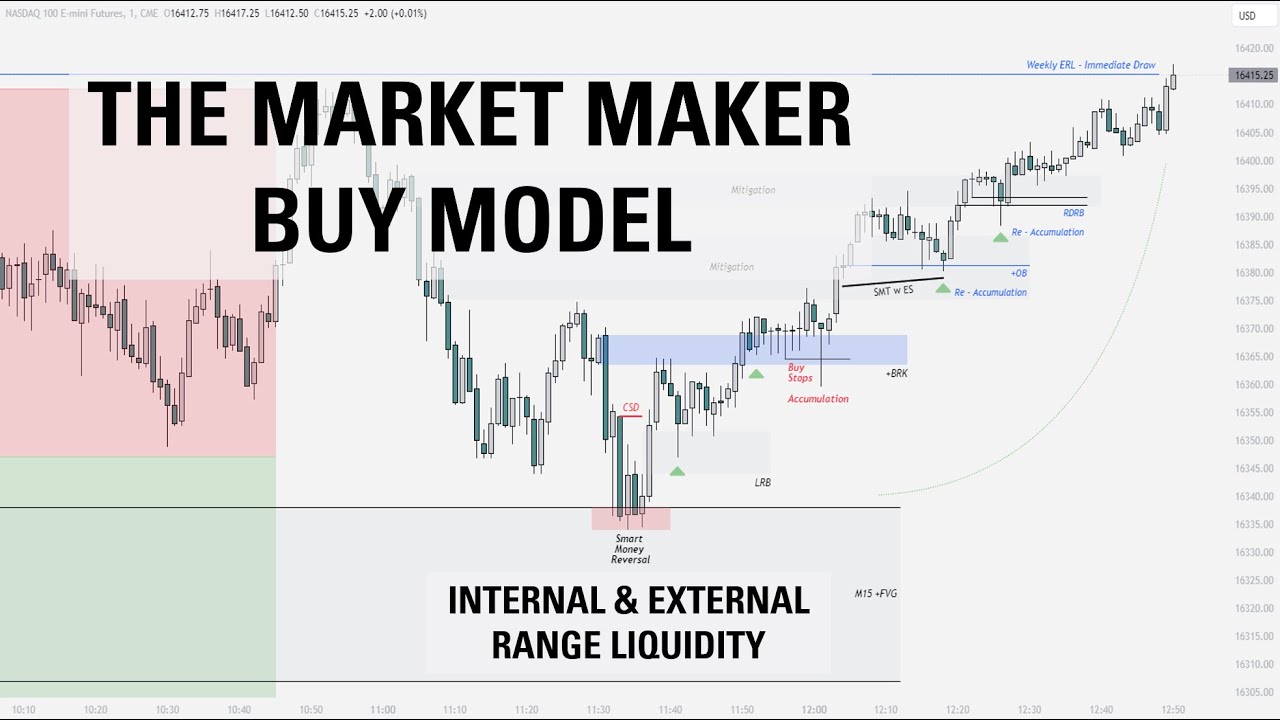
The Market Maker Buy Model | Full Trade Breakdown $NQ

Time & Price Algorithmic Trading: Draw On Liquidity
5.0 / 5 (0 votes)