Normal Distributions Explained – With Real-World Examples
Summary
TLDRThis video explains the concept of the normal distribution, a common statistical pattern found in nature and various measurements. It covers the bell curve shape, where most data points cluster around a central mean, with fewer occurrences on either side. Key concepts such as the mean, standard deviation, and the empirical rule are explored, along with their role in predicting probabilities. The video also demonstrates how these statistical tools can be used for real-world measurements, like head circumferences and heights, and introduces the z-score for calculating probabilities related to rare events.
Takeaways
- 😀 The normal distribution is a common pattern found in various data, such as people's heights, animal weights, and daily revenues. It forms a bell curve with a single peak and tapers off symmetrically on both sides.
- 😀 The bell curve is often referred to as the normal distribution, and it can be described using two key parameters: the mean (μ) and the standard deviation (σ).
- 😀 The mean (μ) represents the center of the distribution, while the standard deviation (σ) determines how spread out the values are.
- 😀 The empirical rule of normal distribution states that 68% of data points fall within one standard deviation of the mean, 95% within two, and 99.7% within three.
- 😀 Values that are more than three standard deviations from the mean (3-sigma events) are rare and can signal unusual occurrences or discoveries.
- 😀 The normal distribution can vary between different sets of data, such as head sizes in men and women, even though they all follow the general bell curve pattern.
- 😀 Calculating the mean involves adding all values together and dividing by the number of data points. Standard deviation involves squaring the differences from the mean, averaging them, and taking the square root.
- 😀 The variance measures the spread of data, but the standard deviation is easier to interpret because it’s in the same units as the original data.
- 😀 The probability density function (PDF) describes how values are distributed in a normal distribution. The area under the curve represents probabilities.
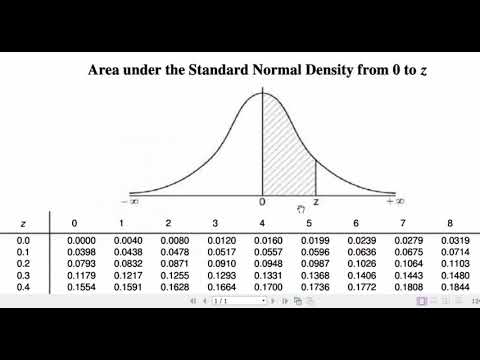
- 😀 Z-scores, which represent how many standard deviations a value is from the mean, can be used to calculate probabilities using the cumulative distribution function (CDF), which gives the probability of a value being less than a specific number.
Q & A
What is the normal distribution?
-The normal distribution is a statistical concept that describes how data points tend to cluster around a central value, with most values being close to the mean and fewer values appearing as they get farther from the center. Its graph is often referred to as the 'bell curve'.
What is the empirical rule?
-The empirical rule states that in a normal distribution, approximately 68% of the data falls within one standard deviation of the mean, 95% falls within two standard deviations, and 99.7% falls within three standard deviations.
What is the significance of the standard deviation in a normal distribution?
-The standard deviation measures how spread out the data is around the mean. A smaller standard deviation indicates the data is tightly clustered around the mean, while a larger standard deviation indicates the data is more spread out.
How can you calculate the mean of a data set?
-To calculate the mean, you sum all the values in the data set and then divide the sum by the number of values. This gives you the average, or center, of the distribution.
What does a z-score represent?
-A z-score indicates how many standard deviations a particular value is away from the mean. It allows you to understand the relative position of a data point within the normal distribution.
What is the difference between the mean and standard deviation?
-The mean is the central point of a data set, representing the average, while the standard deviation measures the spread or dispersion of the data around that mean.
Why is the variance important in statistics?
-Variance provides a measure of the spread of data points by calculating the average of the squared differences from the mean. It helps us understand the degree of variability in the data, although its units are in squares, which can be harder to interpret than the standard deviation.
What does a 'three sigma event' mean?
-A 'three sigma event' refers to an occurrence that is three standard deviations away from the mean in a normal distribution. Such events are considered rare, but still possible. This is commonly used in scientific and engineering contexts to define unusual but not impossible events.
How do you apply the normal distribution to real-world data?
-To apply the normal distribution, you calculate the mean and standard deviation of your data. Then, you can use these values to understand the typical range of data points, make predictions, and assess the likelihood of certain values occurring.
What tools can be used to calculate probabilities for a normal distribution?
-Software tools like spreadsheets (Google Sheets, Excel), programming languages (Python, R), and scientific calculators have built-in functions to calculate probabilities related to the normal distribution, such as using z-scores and cumulative distribution functions (CDFs).
Outlines

This section is available to paid users only. Please upgrade to access this part.
Upgrade NowMindmap

This section is available to paid users only. Please upgrade to access this part.
Upgrade NowKeywords

This section is available to paid users only. Please upgrade to access this part.
Upgrade NowHighlights

This section is available to paid users only. Please upgrade to access this part.
Upgrade NowTranscripts

This section is available to paid users only. Please upgrade to access this part.
Upgrade NowBrowse More Related Video

The Normal Distribution and Shoplifting (DeSTRESS Film 12)
Peluang Distribusi NORMAL beserta Contoh Soal Pembahasan

Normal Curve - Bell Curve - Standard Deviation - What Does It All Mean? Statistics Help
The Central Limit Theorem, Clearly Explained!!!
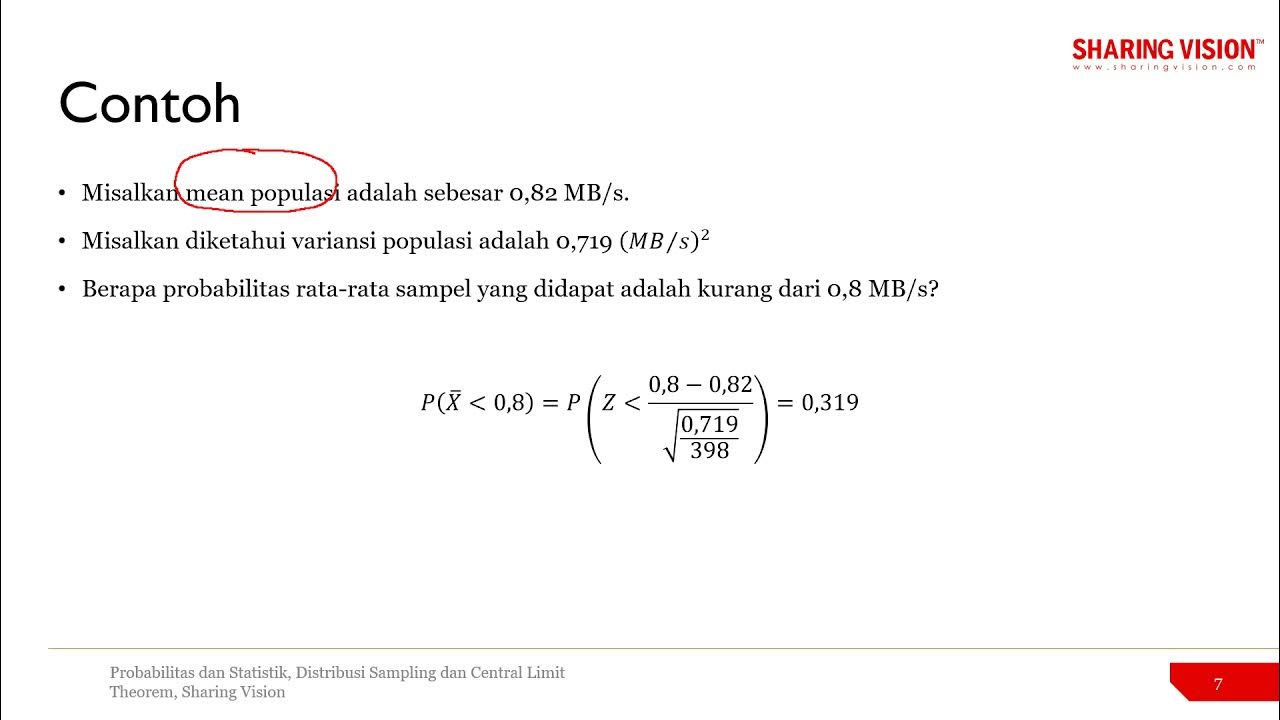
Probabilitas dan Statistik: 8.8 Central Limit Theorem Contoh
CONVERTING A NORMAL RANDOM VARIABLE TO A STANDARD NORMAL VARIABLE AND VICE VERSA
5.0 / 5 (0 votes)