STOP Trading Sebelum Paham Liquidity! Ini Kunci Market Structure
Summary
TLDRThis video explains the fundamental concept of liquidity in trading, focusing on how traders can identify potential price movements and make profitable trades. It breaks down the two types of liquidity: external (at key swing highs and lows) and internal (created within these levels), and explains how they interact to signal trends or reversals. The video also covers the concepts of liquidity runs and swipes, offering insights on how to predict market movements based on breakout structures and fair value gaps. Lastly, it demonstrates how to apply top-down analysis in trading for accurate market setups.
Takeaways
- 😀 Liquidity refers to the area on a chart filled with unexecuted orders, often where retail traders' stop-loss orders are concentrated.
- 😀 External liquidity is the area at previous swing highs or lows, and it plays a crucial role in determining if the market will continue its trend or reverse.
- 😀 Internal liquidity is liquidity formed within external liquidity areas, such as support, resistance, supply and demand zones, or fair value gaps.
- 😀 The relationship between internal and external liquidity is key to understanding market movements and potential reversals.
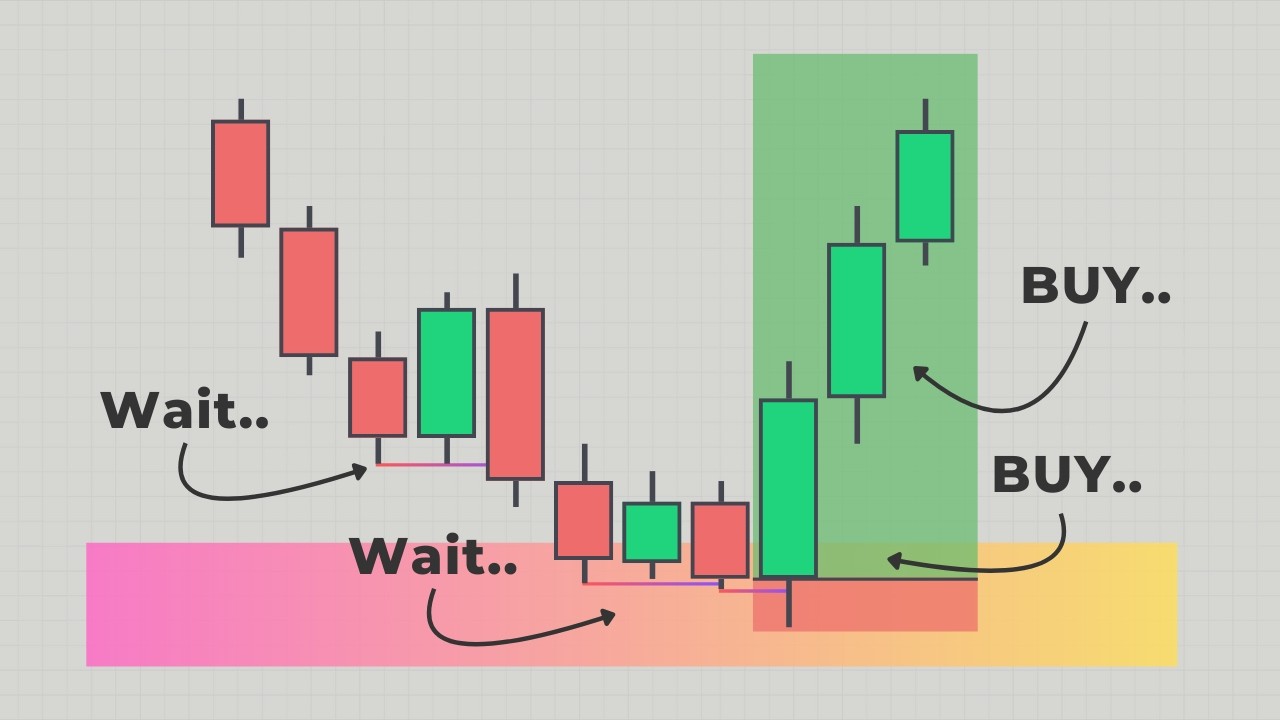
- 😀 In an uptrend, a breakout above a swing high creates external liquidity, and internal liquidity (like fair value gaps) is used as fuel for the next bullish wave.
- 😀 A liquidity run occurs when the price breaks through external liquidity and continues in the same direction, confirmed by a bullish fair value gap formed after the breakout.
- 😀 A liquidity swipe happens when the price fails to break through external liquidity, signaling a potential trend reversal, often accompanied by a fakeout.
- 😀 For liquidity runs, the fair value gap must form after the breakout for a high-probability continuation of the trend.
- 😀 In liquidity swipes, if a bullish fair value gap forms before the breakout, it suggests a higher probability of a reversal.
- 😀 Top-down analysis can be used to identify the actionable market and optimal entry points. This involves confirming larger market directions on higher time frames, like H4, and refining entry points on smaller time frames, like M15.
Q & A
What are the two main challenges traders face regarding liquidity?
-Traders often face two challenges regarding liquidity: first, determining which price level is the target for the next price movement, and second, figuring out whether the price will continue the trend or reverse direction.
What is liquidity in trading, and how is it represented on a chart?
-Liquidity in trading refers to areas on the chart filled with unexecuted orders, often where retail traders' stop-loss orders are concentrated. These areas appear as external or internal liquidity, representing where price movement can target or reverse.
What is external liquidity, and why is it important?
-External liquidity is found at the previous swing high or low. It is important because it represents a critical level where a trend may either continue or reverse, often seen in liquidity runs or liquidity swipes.
What is internal liquidity, and how does it relate to external liquidity?
-Internal liquidity forms within the external liquidity area and includes support, resistance, supply, demand, or fair value gaps. It serves as a temporary support level that the market can use as fuel before targeting the external liquidity level.
How does the combination of internal and external liquidity help in predicting price movement?
-The combination of internal and external liquidity helps predict price movement by showing how the market interacts with these areas. If internal liquidity isn't dispersed by price, it may signal a reversal, indicating a change in market direction.
What is the difference between a liquidity run and a liquidity swipe?
-A liquidity run occurs when the price breaks through external liquidity and continues in the same direction, while a liquidity swipe happens when the price breaks through external liquidity but reverses direction.
How can you confirm a liquidity run after a breakout?
-To confirm a liquidity run after a breakout, look for a bullish fair value gap forming above the breakout level, indicating that buyers have the strength to push the price higher.
What signals a liquidity swipe after a breakout?
-A liquidity swipe occurs when the price fails to close above the breakout level, signaling that buyers are losing momentum and forming a fakeout. This is a strong indicator that a market reversal may be imminent.
How do you identify a potential reversal after a liquidity swipe?
-After a liquidity swipe, if the price creates a fair value gap below the last high, it signals a potential reversal. Additional confirmation comes when the price breaks through the previous swing low, forming a change of character.
How can top-down analysis be used to create an actionable trading setup?
-Top-down analysis involves analyzing the chart on a larger time frame (e.g., H4) to determine the overall market direction and then refining the entry on smaller time frames (e.g., M15). Confirmation through fair value gaps and changes of character on smaller time frames enhances the accuracy of trade setups.
Outlines

This section is available to paid users only. Please upgrade to access this part.
Upgrade NowMindmap

This section is available to paid users only. Please upgrade to access this part.
Upgrade NowKeywords

This section is available to paid users only. Please upgrade to access this part.
Upgrade NowHighlights

This section is available to paid users only. Please upgrade to access this part.
Upgrade NowTranscripts

This section is available to paid users only. Please upgrade to access this part.
Upgrade NowBrowse More Related Video

Liquidity Sweeps Explained

LIQUIDITY INDUCEMENT MASTERCLASS | Forex Trading With 'Smart Money' Concepts

The 4 Reasons Markets ACTUALLY Move (Draw on Liquidity Explained)

ICT Charter Price Action Model 7 - Supplementary Lesson

Trading Liquidity ~ How It Works (& how to profit from it)
1 Trading Mistake That Keeps You Unprofitable (Here’s the Fix)
5.0 / 5 (0 votes)