💥[a = Δv / Δt] GRÁFICO VxT | MUV - Movimento Uniformemente Variado gráficos ∫ f( Prof. Telmo )dλ
Summary
TLDRIn this video, the speaker reviews key concepts of uniformly varied motion, focusing on velocity-time graphs and their relation to kinematic principles. The discussion covers topics like initial speed, acceleration, and how to calculate distance traveled using areas under the graph. The speaker explains acceleration in different sections and emphasizes the importance of practicing calculations for mastering physics. Practical exercises are included, where the audience calculates distance and average speed based on graphical data. The video wraps up with encouragement to engage with the material and share feedback to support the channel.
Takeaways
- 😀 The video covers topics related to uniformly varied motion, focusing on key concepts like velocity, acceleration, and distance.
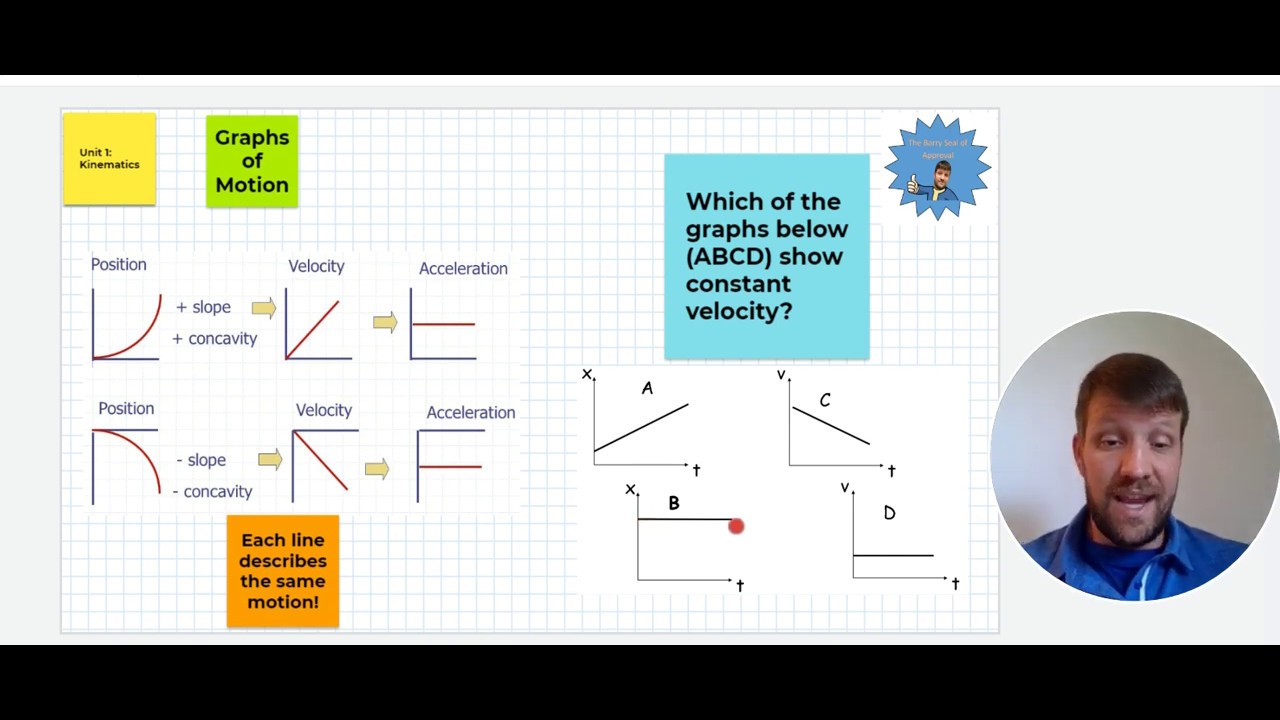
- 😀 It emphasizes understanding the velocity versus time graph, where the slope indicates acceleration and the area under the graph gives the distance traveled.
- 😀 A breakdown of how to calculate acceleration using the change in velocity (Delta V) and time (Delta T) is provided, with a real-world example.
- 😀 The concept of change in direction is discussed, explaining how velocity can be positive or negative, and when the graph touches zero, it represents the car stopping.
- 😀 The calculation of distance involves finding the area under the graph, using geometric shapes like triangles and trapezoids to represent motion intervals.
- 😀 A review of basic kinematics concepts like velocity, acceleration, and the relationship between them is emphasized for clarity and understanding.
- 😀 The script introduces various graphs: a positive acceleration graph where velocity increases, and a negative acceleration graph where velocity decreases.
- 😀 A practical exercise is provided to calculate the distance and average speed based on a given velocity-time graph, helping to reinforce concepts.
- 😀 The formula for average speed in uniformly varied motion is shown, where the initial and final speeds are averaged to find the average velocity.
- 😀 The video concludes with additional exercises that help students practice finding acceleration and distance, using both the area of geometric shapes and basic motion formulas.
Q & A
What is the primary focus of the video?
-The primary focus of the video is on uniformly varied motion and its graphical representation, particularly the velocity vs. time graph. The video also covers concepts like acceleration, distance traveled, and average speed in uniformly varied motion.
What does the speaker mean by 'uniformly varied movement'?
-Uniformly varied movement refers to motion where the object’s velocity changes at a constant rate over time, meaning the acceleration is constant.
How is the velocity vs. time graph constructed in the video?
-The velocity vs. time graph is constructed by first creating a table of values for time and velocity. Points are plotted for each time value, and a line is drawn to represent the velocity's change over time.
What is the significance of the area under the velocity vs. time graph?
-The area under the velocity vs. time graph represents the distance traveled by the object. The graph's area can be calculated using geometric shapes, like triangles, to find the total distance covered.
What role does acceleration play in uniformly varied motion?
-Acceleration in uniformly varied motion is constant. It is calculated by dividing the change in velocity (ΔV) by the change in time (ΔT). Acceleration determines how quickly the object's velocity is changing over time.
How do you calculate average speed in uniformly varied motion?
-Average speed in uniformly varied motion can be calculated by taking the sum of the initial and final speeds, then dividing by 2. Alternatively, distance traveled divided by the total time can also give the average speed.
What do positive and negative acceleration represent in the context of the video?
-Positive acceleration indicates the object is speeding up, while negative acceleration (also known as deceleration) means the object is slowing down. These are represented on the graph by either an upward or downward slope, respectively.
What is the 'change of direction' point on a velocity vs. time graph?
-The 'change of direction' point is where the velocity crosses zero on the graph. This represents a moment when the object stops and reverses direction, transitioning from negative velocity to positive velocity or vice versa.
How can the distance traveled be found using the velocity vs. time graph?
-The distance traveled is found by calculating the area under the velocity vs. time graph. This area can be determined using basic geometry, such as the area of triangles or trapezoids, depending on the shape of the graph.
What types of graphs are used to represent motion with positive and negative acceleration?
-For positive acceleration, the velocity vs. time graph shows an upward slope, indicating increasing velocity. For negative acceleration, the graph shows a downward slope, indicating decreasing velocity.
Outlines

This section is available to paid users only. Please upgrade to access this part.
Upgrade NowMindmap

This section is available to paid users only. Please upgrade to access this part.
Upgrade NowKeywords

This section is available to paid users only. Please upgrade to access this part.
Upgrade NowHighlights

This section is available to paid users only. Please upgrade to access this part.
Upgrade NowTranscripts

This section is available to paid users only. Please upgrade to access this part.
Upgrade NowBrowse More Related Video

Movimento Uniformemente Variado I (MUV) - Cinemática - Aula 7 - Prof. Boaro

Aprenda a LER um Gráfico de VELOCIDADE X TEMPO | CINEMÁTICA
Movimento Uniformemente Variado (Teoria e Exemplos)

GERAK LURUS BERUBAH BERATURAN (GLBB) - GERAK LURUS (FISIKA SMA)

Movimento uniformemente variado - física
AP Physics 1 - Unit 1 Summary - Kinematics
5.0 / 5 (0 votes)