Ultimate Market Structure Course - Smart Money Concepts
Summary
TLDRIn this advanced tutorial on smart money trading, viewers learn to analyze market structure by identifying trends, pullbacks, breaks, and reversals. The video focuses on understanding candlestick patterns, impulsive and corrective moves, as well as break of structure (BOS) and change of character (COC) to spot key market shifts. Through real chart examples, the tutorial demonstrates how to apply these concepts in both bullish and bearish scenarios, emphasizing the importance of multi-time frame analysis. Mastering these techniques equips traders to make better, more strategic decisions in the market.
Takeaways
- 😀 Valid pullbacks are essential for confirming trends, breaks, and reversals in smart money trading, and are identified by candlestick patterns that take out previous highs or lows.
- 😀 In a bullish trend, a pullback is valid when a candle breaks below the previous low, while in a bearish trend, it is valid when a candle breaks above the previous high.
- 😀 Impulsive moves indicate strong market momentum, whereas corrective moves are temporary retracements or reversals that clear out liquidity and could signal trend reversals.
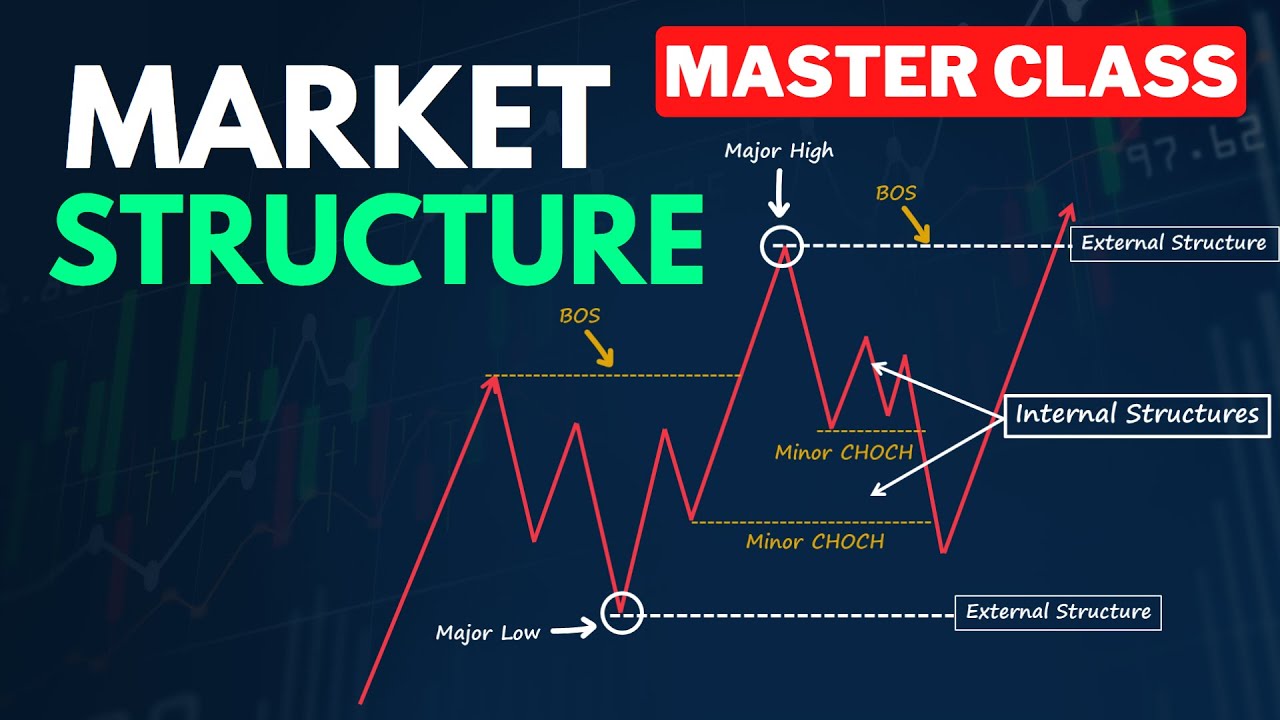
- 😀 A break of structure occurs when price breaks above the most recent higher low in a bullish trend, or below the most recent lower high in a bearish trend, confirming the market’s continued direction.
- 😀 A change of character signals a potential reversal, identified when price breaks below the lowest point of a corrective move in an uptrend or above the highest point in a downtrend.
- 😀 Liquidity sweeps can happen through wick or candle close, both of which are valid for confirming a break of structure or change of character.
- 😀 Multiple time frame analysis is crucial for getting a comprehensive view of market direction, confirming trends, and identifying key levels of support and resistance.
- 😀 Higher time frames should be used to identify the overall market direction and key levels, while lower time frames are more suited for detailed analysis and entry points.
- 😀 Combining analysis across multiple time frames strengthens the validity of trading setups and improves the probability of successful trades.
- 😀 Mastering the concepts of market structure, pullbacks, liquidity sweeps, and trend reversals can help traders make more informed, strategic decisions and enhance risk management.
Q & A
What is the main focus of this video on smart money trading?
-The video focuses on advanced concepts of market structure in smart money trading, including how to identify trends, breaks, and reversals. It teaches a mechanical process for marking and mapping market structure and combining multiple time frames for professional trading.
How do you identify a valid pullback in the market?
-A valid pullback is identified by a candlestick breaking below the lowest point of the previous one (in a bullish scenario) or above the highest point (in a bearish scenario), and it must sweep liquidity. This confirms the pause in price movement before the trend resumes.
What role do candlesticks play in identifying market trends?
-Candlesticks are crucial for identifying market trends as they represent price movements. In an uptrend, the market prints a series of bullish candlesticks exceeding the previous high, while in a downtrend, bearish candlesticks break below previous lows, confirming momentum.
What is the difference between an impulsive move and a corrective move in market structure?
-An impulsive move refers to a strong, directional movement indicating momentum in the market (either bullish or bearish). A corrective move, on the other hand, is a temporary retracement or reversal, usually counteracting the impulsive move before the trend continues.
What is a break of structure and how is it identified?
-A break of structure occurs when the price breaks above or below the previous market structure level after a corrective move. This signals a continuation of the trend in the same direction. A valid break requires a close above or below the level, not just a wick.
What does a change of character in the market signal?
-A change of character occurs when the price breaks below the lowest point of a corrective move, indicating a loss of momentum in the current trend. It is an early signal that a reversal might be imminent, signaling a change in market sentiment.
How do you apply market structure concepts in both bullish and bearish trends?
-In both bullish and bearish trends, market structure concepts involve identifying impulsive and corrective moves, break of structures, and changes of character. For a bullish market, impulsive moves create higher highs, while in a bearish market, lower highs and breaks below structure levels indicate potential reversals.
Why is it important to take liquidity into account when analyzing pullbacks?
-Liquidity is important because a valid pullback must sweep liquidity, either by breaking below the low of the previous candlestick (for bullish markets) or above the high (for bearish markets). This confirms that the market has absorbed enough orders before continuing the trend.
What are the benefits of analyzing market structure across multiple time frames?
-Analyzing market structure across multiple time frames provides a broader perspective, helping traders confirm trends, identify key levels, and spot patterns that may not be apparent in a single time frame. This enhances the accuracy of trading decisions, risk management, and entry/exit points.
How does multi-time frame analysis help in smart money trading?
-Multi-time frame analysis helps traders by aligning the market structure across different time intervals. It strengthens the validity of the analysis when higher and lower time frames align, giving traders better confidence in their trades and increasing the probability of success.
Outlines

This section is available to paid users only. Please upgrade to access this part.
Upgrade NowMindmap

This section is available to paid users only. Please upgrade to access this part.
Upgrade NowKeywords

This section is available to paid users only. Please upgrade to access this part.
Upgrade NowHighlights

This section is available to paid users only. Please upgrade to access this part.
Upgrade NowTranscripts

This section is available to paid users only. Please upgrade to access this part.
Upgrade NowBrowse More Related Video

How Operator TRAPS New Traders | *FREE Advance Price Action Trading | Smart Money Concepts In Hindi

Best Order Block Trading Strategy of All Time!

Magic of "Market Structure Mapping" | Smart Money Concepts (SMC) Full Course🔥| Episode - 1

3 High Probability Scalping Strategies Using Smart Money Concepts

ICT Smart Money Technique (SMT) Divergence for trend reversal and trade entry
Advanced Market Structure Course (Full Tutorial)
5.0 / 5 (0 votes)