TESLA Stock - Is TSLA Breaking Out?
Summary
TLDRIn this video, the host provides a comprehensive update on Tesla's stock performance amidst a volatile market, highlighting both good and bad news. The analysis covers technical indicators like the MACD, rising triangles, and Fibonacci levels. The host also discusses the potential risks related to global events and market conditions, offering insights into short-term and long-term predictions for Tesla. The focus is on key resistance and support levels, and the possibility of both bullish and bearish movements. Overall, it's an in-depth look at Tesla’s stock with a critical eye on the upcoming challenges and opportunities.
Takeaways
- 😀 Tesla stock had a 2% increase, closing at around $325 per share despite market volatility.
- 😀 The broader market experienced significant swings, particularly in the second half of the day due to geopolitical tensions between Iran and Israel.
- 😀 The 1-hour time frame chart shows promising signs for bulls with a potential breakout pattern forming.
- 😀 Tesla's recent news about robo-taxis and automated vehicle approvals triggered a spike in stock price.
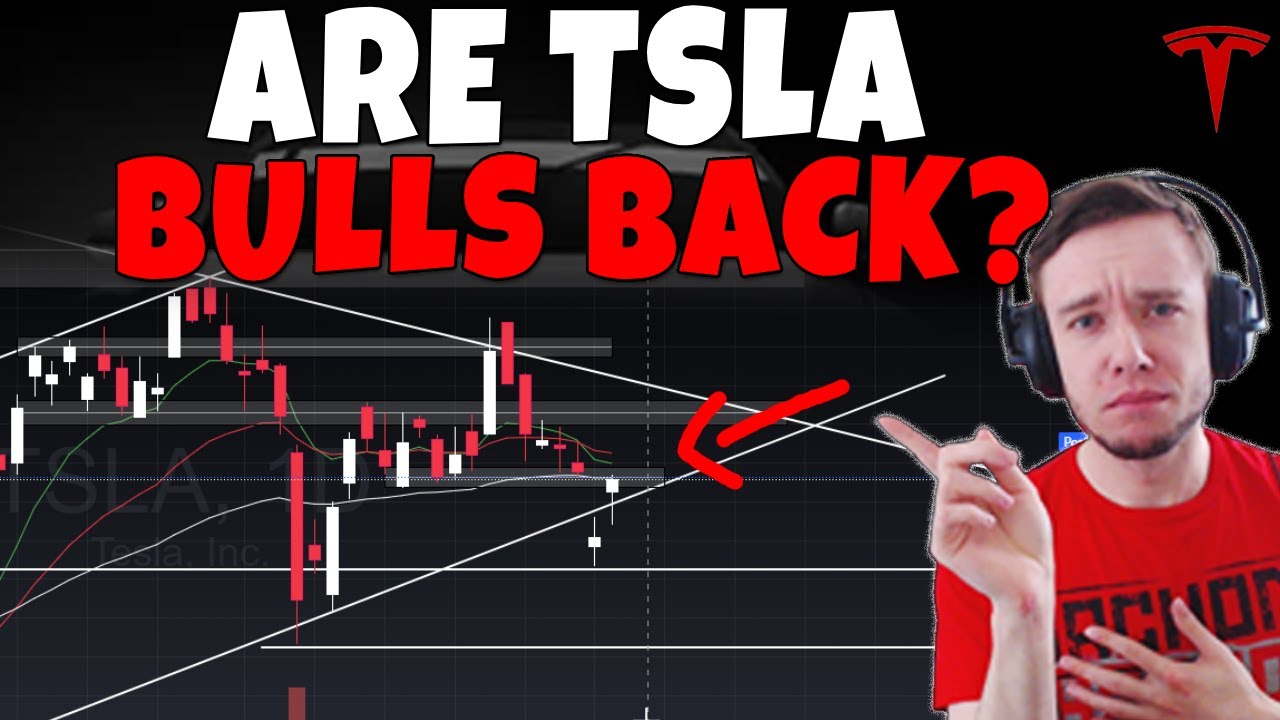
- 😀 A key resistance level remains in the mid-330s, which Tesla needs to break in order to sustain momentum.
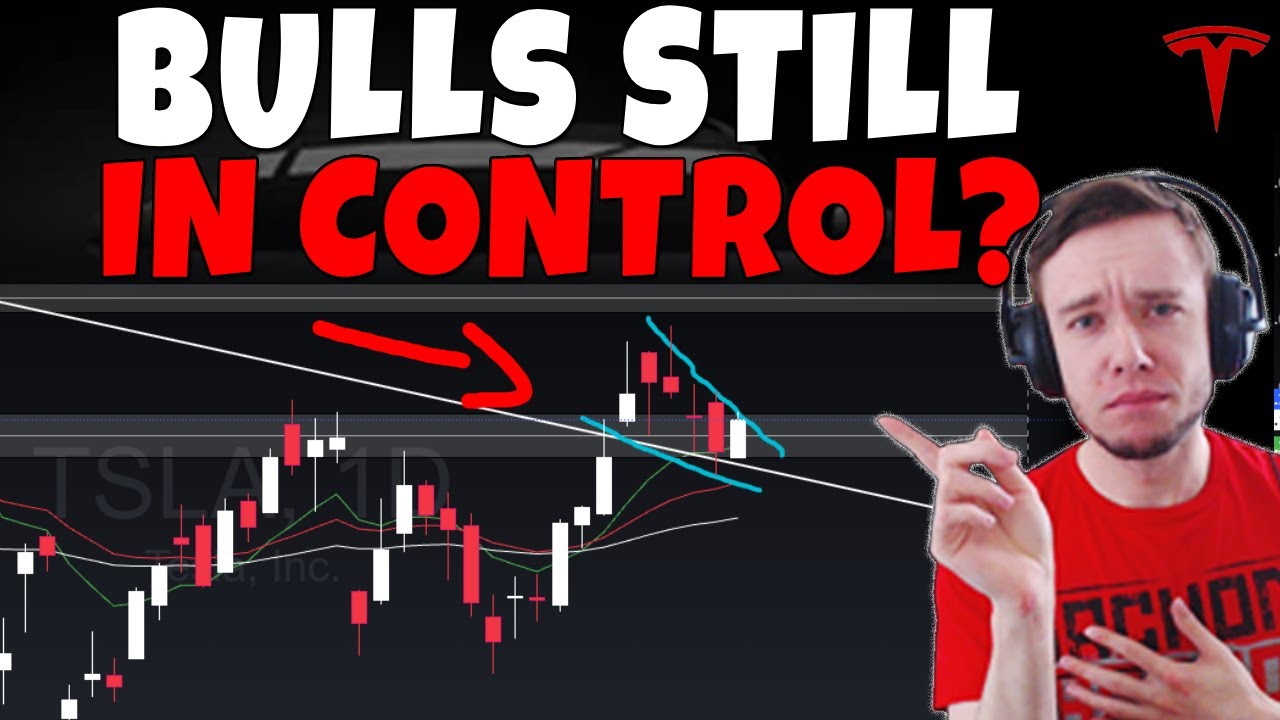
- 😀 There's a potential rising triangle pattern forming on the 1-hour chart, signaling a bullish outlook if key levels hold.
- 😀 The daily time frame shows a bearish MACD crossover, which remains a concern despite some short-term bullish movement.
- 😀 For further bullish confidence, a daily close above the trendline and the mid-330s level would be needed, ideally with a strong stochastic reading.
- 😀 Tesla's stock may experience short-term bullishness, but medium-term risks remain due to a possible bearish flag pattern on the larger time frame.
- 😀 Losing key support levels, particularly the $290 to $300 range, could open the door for a significant decline, possibly leading to new lows near $170 to $180.
- 😀 Despite the risks, any bounce at the green trendline around $170 would offer an attractive buying opportunity, as previous bounces at this level have been substantial.
Q & A
What was the primary focus of the Tesla stock update video?
-The video focused on analyzing Tesla's stock performance in the context of the broader market, including a discussion of the market's volatility due to geopolitical events, particularly involving Iran and Israel.
What was Tesla's performance on the day of the analysis?
-Tesla's stock closed up about 2% on the day, at approximately $325 per share, which was considered impressive given the overall market's volatility.
What did the video suggest about the state of the market?
-The video noted that the market was experiencing wild swings, particularly in the second half of the day, influenced by geopolitical concerns, such as the situation between Iran and Israel.
What were the potential risks mentioned regarding the market and Tesla stock?
-The video highlighted the uncertainty surrounding the geopolitical situation and the increased risk indicated by the VIX closing above 20, which could affect stock performance, including Tesla's.
What technical analysis did the video discuss about Tesla's stock?
-The video discussed a breakout on the 1-hour time frame, where Tesla's stock broke out of a tight trading range, indicating potential for further upward movement if certain levels were reclaimed, particularly the mid-330s region.
What pattern did the video suggest might form in Tesla's stock chart?
-The video suggested that Tesla's stock could form a rising triangle pattern, characterized by higher lows and equal highs, which is typically a bullish formation. This pattern was compared to past instances of similar chart behavior in Tesla's history.
What was the key resistance level mentioned for Tesla's stock?
-The key resistance level mentioned was in the mid-330s, which Tesla's stock had struggled to break through in recent trading. Breaking this level would be crucial for bullish momentum.
What concerns were raised regarding the daily chart and the MACD indicator?
-The video pointed out that the MACD indicator on the daily chart was still showing a bearish crossover, which posed a concern. This was seen as the opposite of a previous bullish crossover that had led to significant upward movement, raising doubts about the sustainability of the current rally.
What long-term perspective did the video provide regarding Tesla's price action?
-The video suggested that Tesla's price action could be part of a larger bearish flag pattern from its all-time highs, which could result in a significant downturn if the stock fails to break through key resistance levels in the short term.
What is the potential downside risk for Tesla's stock, according to the video?
-The video warned that if Tesla's stock loses key levels such as the 290-300 range, it could lead to further downside, potentially dropping to as low as the 170-180 range, depending on the broader market conditions and the breakout pattern that unfolds.
Outlines

This section is available to paid users only. Please upgrade to access this part.
Upgrade NowMindmap

This section is available to paid users only. Please upgrade to access this part.
Upgrade NowKeywords

This section is available to paid users only. Please upgrade to access this part.
Upgrade NowHighlights

This section is available to paid users only. Please upgrade to access this part.
Upgrade NowTranscripts

This section is available to paid users only. Please upgrade to access this part.
Upgrade Now


5.0 / 5 (0 votes)