Google Sheets - Dashboard Tutorial - Part 1
Summary
TLDRThis tutorial demonstrates how to create a functional dashboard using Google Sheets, with a focus on data visualization and interactivity. The video covers key techniques such as utilizing the QUERY function, creating pivot tables, and incorporating dynamic filters for sales performance reports. It walks through setting up user input for date ranges, breaking down sales by brand, state, and sales representative, and even adding geo charts. The tutorial emphasizes practical functionality rather than design, making it a great starting point for building a customized, data-driven dashboard in Google Sheets.
Takeaways
- 😀 You can build functional dashboards in Google Sheets, even though Google Data Studio might be a better choice for more robust dashboards.
- 😀 The dashboard will allow for dynamic updates with one filter that controls all reports, such as changing the region or date range.
- 😀 The core functions you'll need to understand are QUERY, JOIN, CONCATENATE, PIVOT TABLES, and IF functions.
- 😀 Create a dynamic copy of your transaction data using the QUERY function to facilitate dashboard updates.
- 😀 Design and functionality should focus on the user’s needs—focusing on data-driven reports rather than aesthetics.
- 😀 To build your reports, start by creating pivot tables for sales breakdowns by different categories (e.g., by brand or by state).
- 😀 Pivot tables should dynamically update as more data is added, requiring you to adjust range references to encompass entire columns.
- 😀 Use geo charts to visually display data on a map, such as total sales by state, and adjust settings to show the United States specifically.
- 😀 Incorporate calculated fields to add insights like average sales per sales rep, and ensure dynamic updates in reports.
- 😀 Use charts and data validation to enhance the presentation and interactivity of the dashboard, making it easy for users to manipulate data.
- 😀 Hide sheets (like temporary data sets and pivot tables) to keep the dashboard clean and user-friendly.
Q & A
What is the purpose of this video?
-The video demonstrates how to build a functional sales dashboard using Google Sheets, including various reports and charts that update dynamically based on user input like date ranges and regions.
Why is Google Data Studio mentioned, and how does it compare to Google Sheets?
-Google Data Studio is mentioned as a more robust tool for creating visually appealing and feature-rich dashboards. The video focuses on Google Sheets because it’s a more accessible tool for users who may not want to use or have access to Google Data Studio.
What are the core functions required to build the dashboard?
-The key functions needed include the QUERY function, JOIN, TEXT JOIN, CONCATENATE, PIVOT TABLE, IF function, and possibly IFERROR. These help in managing data and creating dynamic reports within Google Sheets.
What does the QUERY function do in this context?
-The QUERY function is used to pull data from the transactions tab into a new temporary data set. This allows for dynamic updates as new rows are added to the transactions data, ensuring that the dashboard is always up-to-date.
How does the date filtering work in the dashboard?
-Date filtering works by allowing users to specify a start and end date for the data. When a date range is selected, all reports and charts in the dashboard update automatically to reflect the selected time frame.
How are pivot tables used to generate reports in this dashboard?
-Pivot tables are used to break down total sales by various categories such as brand, state, and sales rep. They dynamically aggregate data, and the resulting reports are copied into the dashboard. The pivot tables are set to update automatically as new data is added.
What is the role of the geo chart in this dashboard?
-The geo chart visualizes sales data by state, providing a map-based overview of sales performance. It helps users quickly identify regional sales trends by dynamically updating based on the data in the pivot table.
Why is data validation used for start and end date inputs?
-Data validation ensures that users enter valid date formats in the start and end date cells. This prevents errors and ensures that the dashboard filters the data correctly based on the user's input.
What is the significance of the average line in the sales rep performance report?
-The average line in the sales rep performance report provides a benchmark, showing how individual sales reps are performing relative to the average sales. It helps identify top performers and those below the average.
How does the dashboard update automatically when new rows are added to the transactions data?
-The dashboard updates automatically by using dynamic ranges in the pivot tables. Instead of referencing a fixed range, the pivot tables refer to entire columns (e.g., A:H) so that new rows added to the transactions data are included in the reports and charts.
Outlines

This section is available to paid users only. Please upgrade to access this part.
Upgrade NowMindmap

This section is available to paid users only. Please upgrade to access this part.
Upgrade NowKeywords

This section is available to paid users only. Please upgrade to access this part.
Upgrade NowHighlights

This section is available to paid users only. Please upgrade to access this part.
Upgrade NowTranscripts

This section is available to paid users only. Please upgrade to access this part.
Upgrade NowBrowse More Related Video

Getting Started With Using Maps In Tableau | Tableau Maps For Beginners | Data Deep Dive

Sistem Absensi Online Menggunakan kartu RFID
Tableau - Dashboard Introduction
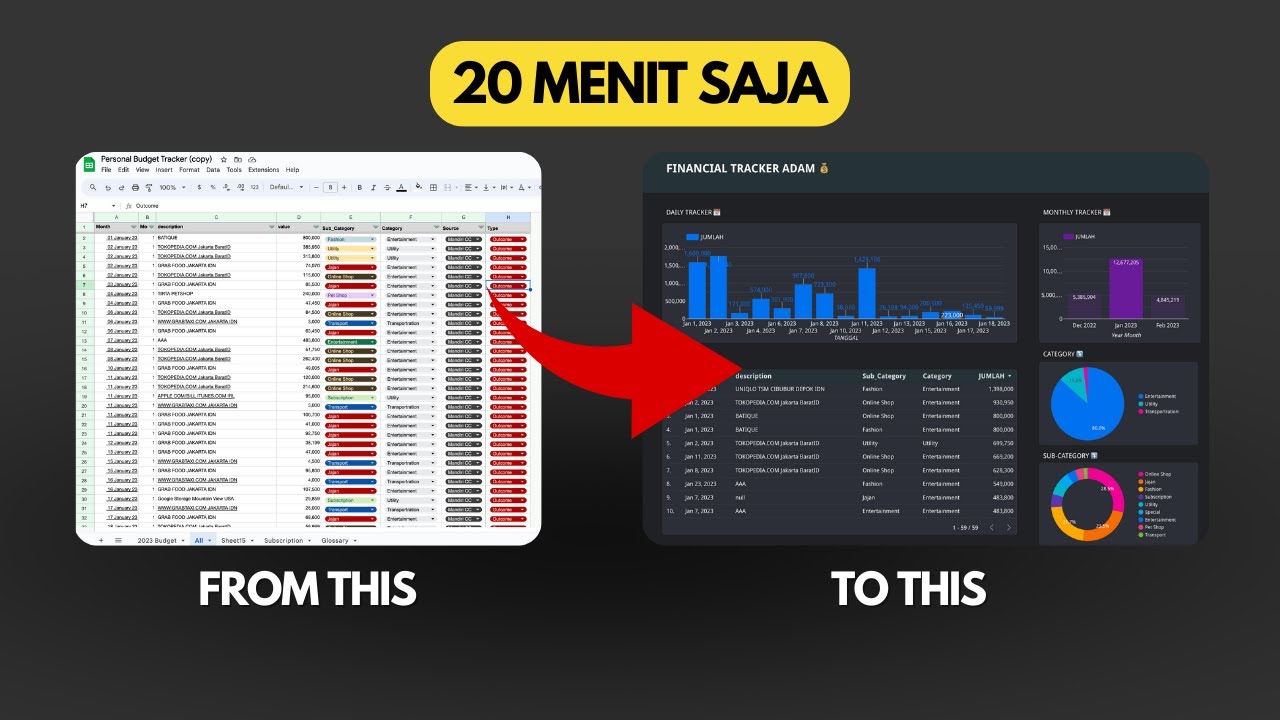
Dashboard Visualisasi Budget Tracker di Looker Studio | Tutorial
📊 How to Build Excel Interactive Dashboards
Read and Write data from google sheets using Python
5.0 / 5 (0 votes)