Bitcoin [BTC]: This will signal the end.
Summary
TLDRThe video analyzes Bitcoin's current market position, highlighting that despite Bitcoin reaching all-time highs, the cycle is approaching its peak, suggesting the potential for distribution before a trend reversal. The presenter emphasizes remaining unbiased and aware of market structures, such as trends and distribution signals, while closely monitoring key levels. With a focus on both macro and short-term factors, the video discusses important market indicators, sentiment readings, and price action trends, stressing the need for caution and defense in the face of possible corrections. The presenter also touches on ongoing strategies and trading tips.
Takeaways
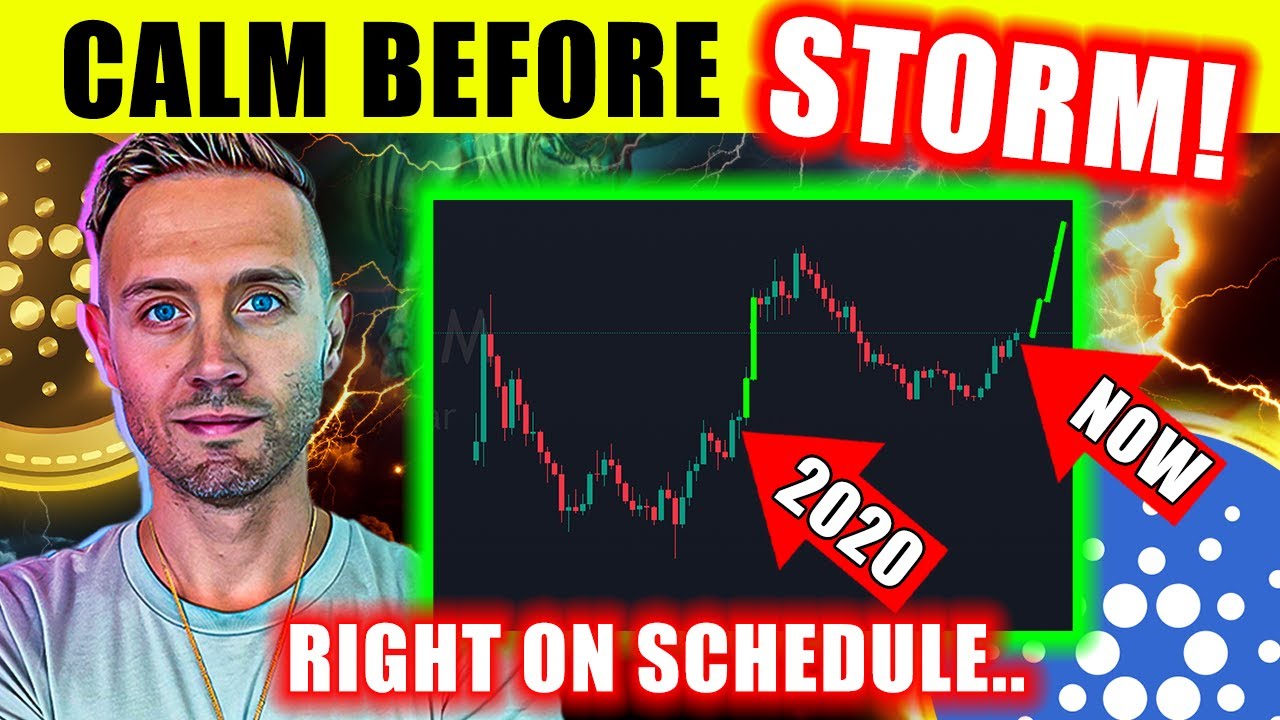
- 😀 Bitcoin is at all-time highs, but the market cycle is over 900 days old, suggesting that a cycle peak may be approaching.
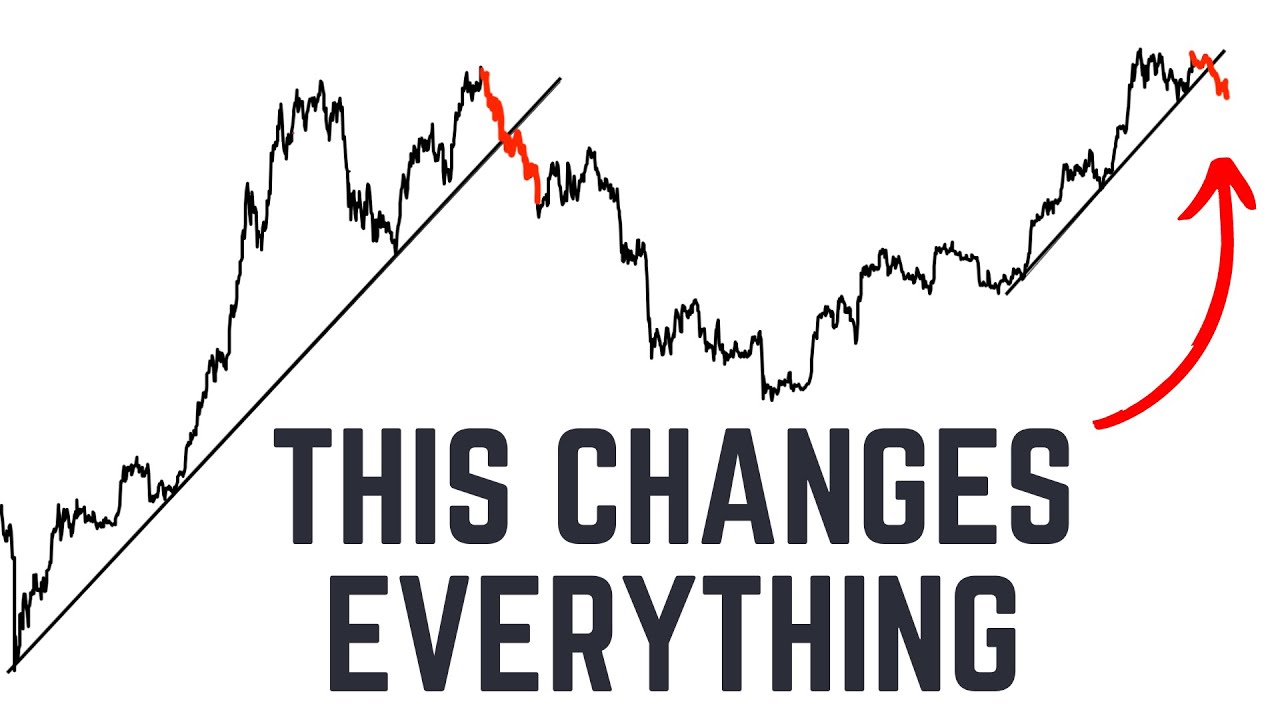
- 😀 Distribution, where there is more selling than buying, is a key signal to watch for as the market nears its peak.
- 😀 The market needs to go through a distribution phase before reaching its final peak, and this happens on both short-term and long-term time frames.
- 😀 Even though Bitcoin is at an all-time high, it's important to remain cautious and avoid being blindly bullish.
- 😀 A strong position for Bitcoin is holding above previous breakout zones, like the $19,000 level.
- 😀 Past market actions show that distribution often leads to a decline, followed by reaccumulation before the trend resumes.
- 😀 The key to identifying distribution is noticing overlapping swings and indecisive market movements.
- 😀 Current market sentiment is showing extreme greed, but this hasn’t yet resulted in significant FOMO, which often indicates a peak.
- 😀 Volume data is essential to watch; higher volume supports higher prices, while lower volume can indicate trouble.
- 😀 Keep an eye on the long/short ratio, as a significant imbalance towards longs could result in a sharp market correction.
- 😀 If a significant breakdown below key support levels like $18,500 occurs, it would signal the start of a larger correction.
Q & A
What is the significance of the Bitcoin cycle being over 900 days old?
-The 900-day mark signals that the Bitcoin cycle is nearing its peak. Historically, Bitcoin cycles tend to reach a high around 900 days, which suggests that we might be approaching a top in the market. This means that while the current price levels are bullish, a market correction could be on the horizon.
What does 'distribution' mean in the context of Bitcoin market cycles?
-'Distribution' refers to a phase where selling exceeds buying. During this phase, the market establishes a range, with resistance (ceiling) and support (floor). This is often seen as a precursor to a market top and potential decline, although it could also be a sign of accumulation depending on how the market moves afterward.
Why is it important to track distribution during a market cycle?
-Tracking distribution is crucial because it indicates the market's readiness to top out or experience a significant reversal. If distribution signals are present, it suggests that selling pressure is increasing, which may lead to a correction or market downturn.
How can you identify signs of distribution on Bitcoin charts?
-Signs of distribution include overlapping swings and indecisiveness in price movement. When Bitcoin prices show lots of overlap in the swings, without a clear continuation or new high, it suggests that distribution may be taking place. This often happens at market peaks when sellers begin to dominate.
What is the importance of the $19,000 breakout zone for Bitcoin?
-The $19,000 breakout zone is critical because it marks the previous cycle peak. If Bitcoin remains above this zone, it indicates that the market is still in a strong position. A failure to hold this level could signal the beginning of a market reversal or significant pullback.
What role do higher time frame trends play in analyzing Bitcoin?
-Higher time frame trends, such as the weekly and monthly charts, provide a broader view of market direction. These trends help traders assess the overall strength of the market and decide whether short-term corrections are temporary or part of a larger market shift.
What does the market sentiment indicator (fear and greed) suggest right now?
-Currently, the fear and greed indicator shows extreme greed. This suggests that the market sentiment is very bullish, but it may also be entering a period of frothy optimism, which could lead to a potential reversal if the greed becomes too excessive.
What is the significance of the spot ETF inflows and outflows?
-Spot ETF inflows and outflows can be inverse indicators of market trends. A significant spike in ETF buying can signal that the market is nearing a top. The lack of large inflows recently suggests that we are not yet at the market's peak, but a large influx of capital could signal a trend reversal.
What are the implications of low volume in the market?
-Low volume is a concerning sign as it can indicate weak market participation. Sustainable upward trends typically require increasing volume. If volume remains low, it could suggest that the rally is not supported by strong buyer demand, making the market more vulnerable to correction.
What does the $93,000 level represent in the current market analysis?
-The $93,000 level is a key support zone based on previous market analysis. If Bitcoin drops below this level, it could signal a shift in the market's trend. As of now, it remains a crucial price point for the market's upward momentum to stay intact.
Outlines

This section is available to paid users only. Please upgrade to access this part.
Upgrade NowMindmap

This section is available to paid users only. Please upgrade to access this part.
Upgrade NowKeywords

This section is available to paid users only. Please upgrade to access this part.
Upgrade NowHighlights

This section is available to paid users only. Please upgrade to access this part.
Upgrade NowTranscripts

This section is available to paid users only. Please upgrade to access this part.
Upgrade NowBrowse More Related Video


5.0 / 5 (0 votes)