ICT Mentorship Core Content - Month 04 - Double Bottom Double Top
Summary
TLDRThis video teaches traders how to understand and use double tops and bottoms in the context of institutional and retail trading. It covers key concepts such as liquidity pools, measured moves, and clean highs/lows. The speaker discusses how market makers target stop orders above double tops and below double bottoms, explaining the role of institutional algorithms in running these stops. Additionally, it highlights the importance of clean price levels and the significance of time frames for accurately predicting market moves. The video emphasizes the need for patience and precision when interpreting market dynamics.
Takeaways
- 😀 Double tops and bottoms are crucial price action patterns that traders must understand to anticipate market reversals and price movement.
- 😀 Retail traders often view double tops as resistance and double bottoms as support, but these levels are frequently manipulated by institutional traders for liquidity.
- 😀 Measured moves are a recurring phenomenon in price action, where price often moves predictably based on past price swings, especially in relation to key levels.
- 😀 Institutions focus on liquidity pools, targeting buy stops above double tops and sell stops below double bottoms to move the market in their favor.
- 😀 A market structure-based approach involves looking at clean highs, clean lows, liquidity voids, and fair value gaps to project potential price moves.
- 😀 Liquidity voids (gaps) and order blocks are key reference points that traders should identify for potential price reversals or continuations.
- 😀 Price often retraces to fill fair value gaps or reach liquidity voids, which provide high-probability price targets for traders.
- 😀 The market often performs runs above or below double tops and bottoms, seeking to clear out buy and sell stops, respectively, before reversing.
- 😀 When analyzing charts, use a higher time frame (e.g., hourly) for better context and avoid focusing solely on smaller time frames like 15-minute charts.
- 😀 The algorithmic trading model remembers key reference points like double tops and bottoms, even if time has passed, and uses them for price projections.
- 😀 Successful trading is about understanding where the market is likely to reach based on liquidity pools and institutional trading behavior, rather than relying solely on traditional support and resistance levels.
Q & A
What is the main focus of the video script?
-The main focus of the video script is on double tops and bottoms in price action, specifically how to analyze them using institutional and retail perspectives, liquidity pools, and measured moves.
What are measured moves in trading?
-Measured moves refer to the concept where a price swing or movement is projected and this projection helps identify potential future price levels. These moves are often seen when price retraces and extends to similar levels based on previous price action.
How do institutional traders and retail traders differ in their approach to double tops?
-Retail traders see double tops as resistance and typically look to short, placing a protective buy stop above the highs. Institutional traders, however, anticipate the market running buy stops above the double top, expecting to liquidate these stops before reversing price.
What is the significance of liquidity pools in the analysis of double tops and bottoms?
-Liquidity pools are areas where large amounts of stop orders (buy or sell) accumulate, typically above or below key price levels like double tops and bottoms. Market makers target these liquidity areas to trigger stop hunts and drive price action.
What is a fair value gap, and how is it relevant to the analysis?
-A fair value gap refers to a price area where there is a lack of trading or a void in price action, usually caused by a large market move. It is relevant because these gaps often get filled, and traders watch for price to revisit these areas as part of their strategy.
How do the concepts of buy and sell stops play a role in institutional trading?
-Buy stops are placed above resistance levels (like a double top), and sell stops are placed below support levels (like a double bottom). Institutional traders look for these stops to create liquidity, which can then be targeted for profit by pushing the market in the opposite direction.
What is a bullish order block and how is it used in this context?
-A bullish order block is a key price level formed by a down candle before a significant upward price move. In this context, it is used as a potential buy zone, where price is expected to rally after reaching it, following a double top or bottom setup.
How does time frame influence the use of double tops and bottoms in trading?
-Time frames affect the size of the expected moves. For example, in lower time frames like 15-minute charts, price movements might only be 10-20 pips, while on higher time frames like hourly charts, moves can be much larger, such as 40-50 pips, as the algorithm targets larger liquidity areas.
Why is it important to highlight double top and double bottom areas on charts?
-Highlighting double top and double bottom areas helps traders identify key reference points where price might either reverse or break out, aiding in making informed decisions about entering or exiting trades.
What role do momentum indicators play in the analysis of double tops and bottoms?
-Momentum indicators help identify divergence or shifts in market strength. For instance, a divergence at a double top could indicate weakening upward momentum, signaling a potential reversal, which can enhance the accuracy of trading decisions.
Outlines

This section is available to paid users only. Please upgrade to access this part.
Upgrade NowMindmap

This section is available to paid users only. Please upgrade to access this part.
Upgrade NowKeywords

This section is available to paid users only. Please upgrade to access this part.
Upgrade NowHighlights

This section is available to paid users only. Please upgrade to access this part.
Upgrade NowTranscripts

This section is available to paid users only. Please upgrade to access this part.
Upgrade NowBrowse More Related Video
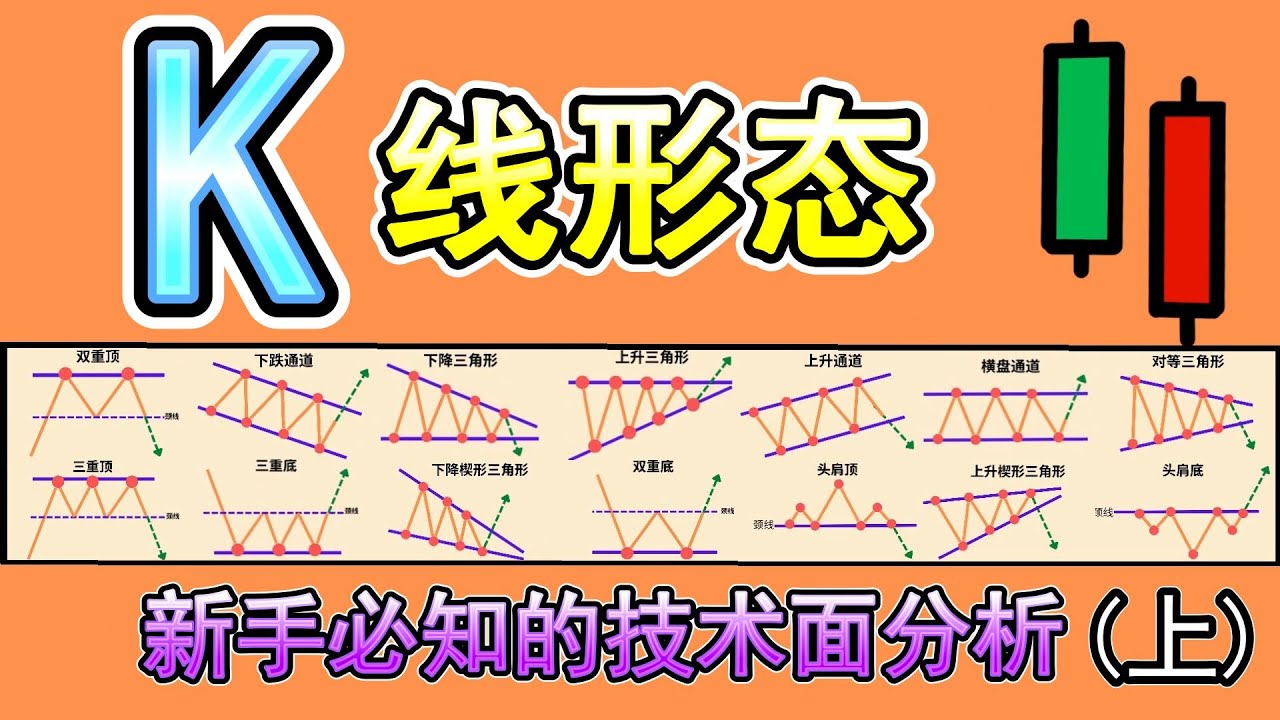
【K线形态 技术面分析】(上)你必知的18种K线形态完整教学|K线形态交易策略大公开|技术分析新手入门教学|专业交易员必备的K线形态技术分析|Chart Pattern Analysis

Technical Analysis Tutorial for Beginners (13 Best Crypto TA Tips)

ICT Mentorship Core Content - Month 03 - Market Maker Trap Head Shoulders Pattern
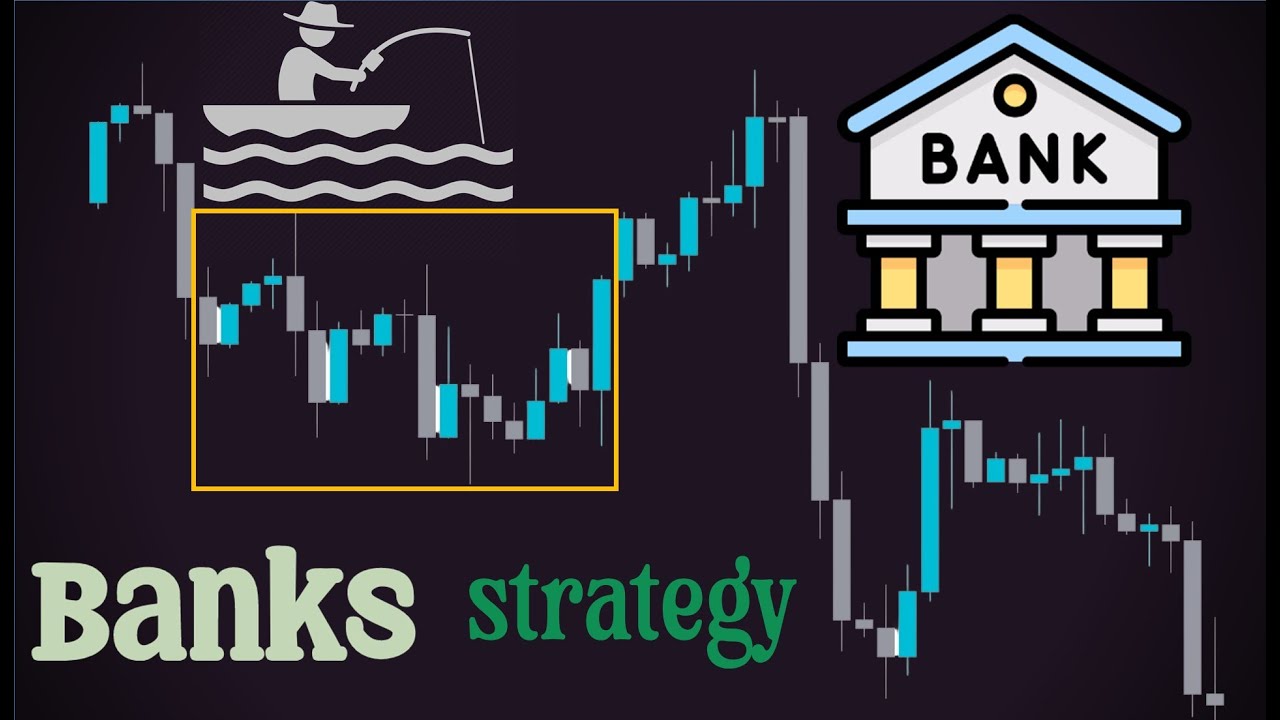
How Banks Manipulate Stop Losses: Strategies for Avoiding Price Reversals?

ICT Forex - Higher Time Frame Concepts

Konsep Smart Money Untuk Pemula || Dasar Strategi Para Big Trader
5.0 / 5 (0 votes)