Cara Menarik Fibonacci dari Nol Untuk Forex, Gold, Crypto
Summary
TLDRThis video provides a comprehensive explanation of Fibonacci and its application in trading. It introduces the concept of Fibonacci, its origins through Leonardo Pisano, and the Golden Ratio (0.618). The video covers Fibonacci retracement as a tool in technical analysis, highlighting how to identify trends, use Fibonacci retracement to find entry points, and determine potential support or resistance levels. The script also explains key levels such as 0.382, 0.5, and 0.618, with insights on market trends, confirming buy or sell positions, and optimizing trading strategies through Fibonacci tools. Viewers are encouraged to use these techniques for profitable trading in various markets.
Takeaways
- 😀 Fibonacci was discovered by Leonardo Pisano, an Italian mathematician born in the 12th century, and it’s not just about numbers but can be observed in nature like snail shells and sunflower seeds.
- 😀 The Fibonacci sequence starts with 0 and 1, with each subsequent number being the sum of the two preceding ones, creating a pattern that leads to the golden ratio of 1.618.
- 😀 The golden ratio, represented as 0.618, is a key concept in Fibonacci retracement tools and can be used in trading to find potential buy or sell positions.
- 😀 Fibonacci retracement is a tool used in trading to determine where a price might correct itself (retrace) in the market after a trend.
- 😀 Fibonacci retracement levels include 0.236, 0.382, 0.5, 0.618, and 0.786, with the key focus on 0.382 to 0.618 for potential entry points.
- 😀 The Fibonacci retracement tool is different from other indicators like RSI and can be found in the tools section of platforms like TradingView.
- 😀 To use Fibonacci retracement, first identify whether the market is in an uptrend or downtrend, as the tool is applied differently depending on the trend's direction.
- 😀 In an uptrend, Fibonacci lines are drawn from the swing low to swing high; in a downtrend, they’re drawn from swing high to swing low to find retracement levels.
- 😀 Key entry points for buying or selling are found when price action reaches the 0.382 to 0.618 Fibonacci levels, with stronger trends typically respecting these levels more firmly.
- 😀 Fibonacci retracement is a great tool to identify potential trade entry points, but always confirm with candlestick patterns or other indicators before making a trade.
- 😀 Setting up stop losses and target points with Fibonacci retracement helps define risk and reward, with stop losses often placed at the 0.786 level, and take profits at 0 or 1.
Q & A
Who is the founder of Fibonacci and what is his background?
-Fibonacci was discovered by Leonardo Pisano, an Italian mathematician who lived between 1170 and 1250. He made significant contributions to mathematics during the 12th century.
How can Fibonacci be observed in everyday life?
-Fibonacci can be seen in various natural phenomena such as the spiral shape of snail shells, the arrangement of sunflower seeds, and the structure of flower petals. Even the human body exhibits Fibonacci proportions.
What is the Fibonacci sequence and how is it formed?
-The Fibonacci sequence begins with 0 and 1, and each subsequent number is the sum of the previous two numbers. For example, 0, 1, 1, 2, 3, 5, 8, 13, etc.
What is the Golden Ratio and how is it related to Fibonacci?
-The Golden Ratio, approximately 1.618, is derived from the ratio of two consecutive Fibonacci numbers. For example, 144 divided by 89 gives the Golden Ratio.
How are Fibonacci retracement levels used in trading?
-Fibonacci retracement levels help identify potential areas where the price might reverse during a trend. Traders often look at key levels like 0.236, 0.382, 0.5, and 0.618 to spot entry points for buying or selling.
What is the difference between Fibonacci and indicators in trading platforms like TradingView?
-Fibonacci is a tool, not an indicator. While indicators are found in the 'indicator' section, Fibonacci tools are located under the 'tools' section in platforms like TradingView.
How does the Fibonacci retracement tool help identify entry points?
-The Fibonacci retracement tool helps traders find potential reversal areas in the market. For example, during an uptrend, the tool is applied from swing low to swing high, and traders look for price retracements at key Fibonacci levels.
What are some key Fibonacci retracement levels traders should focus on?
-Key Fibonacci retracement levels include 0.236, 0.382, 0.5, and 0.618. The most important range to focus on for entry points is between the 0.382 and 0.618 levels.
How does the strength of a trend relate to the Fibonacci retracement levels?
-The strength of a trend can be inferred from where the price bounces at Fibonacci retracement levels. A strong trend might bounce at the 0.382 level, while a weaker trend may bounce at the 0.5 or 0.618 level.
How does one use Fibonacci retracement in both uptrend and downtrend markets?
-In an uptrend, the Fibonacci retracement is drawn from the swing low to the swing high. In a downtrend, it is drawn from the swing high to the swing low. The retracement levels help identify potential reversal zones for trades.
Outlines

This section is available to paid users only. Please upgrade to access this part.
Upgrade NowMindmap

This section is available to paid users only. Please upgrade to access this part.
Upgrade NowKeywords

This section is available to paid users only. Please upgrade to access this part.
Upgrade NowHighlights

This section is available to paid users only. Please upgrade to access this part.
Upgrade NowTranscripts

This section is available to paid users only. Please upgrade to access this part.
Upgrade NowBrowse More Related Video

Pemula Harus Tau! Panduan fibonacci Dari NOl | Trading Masterclass
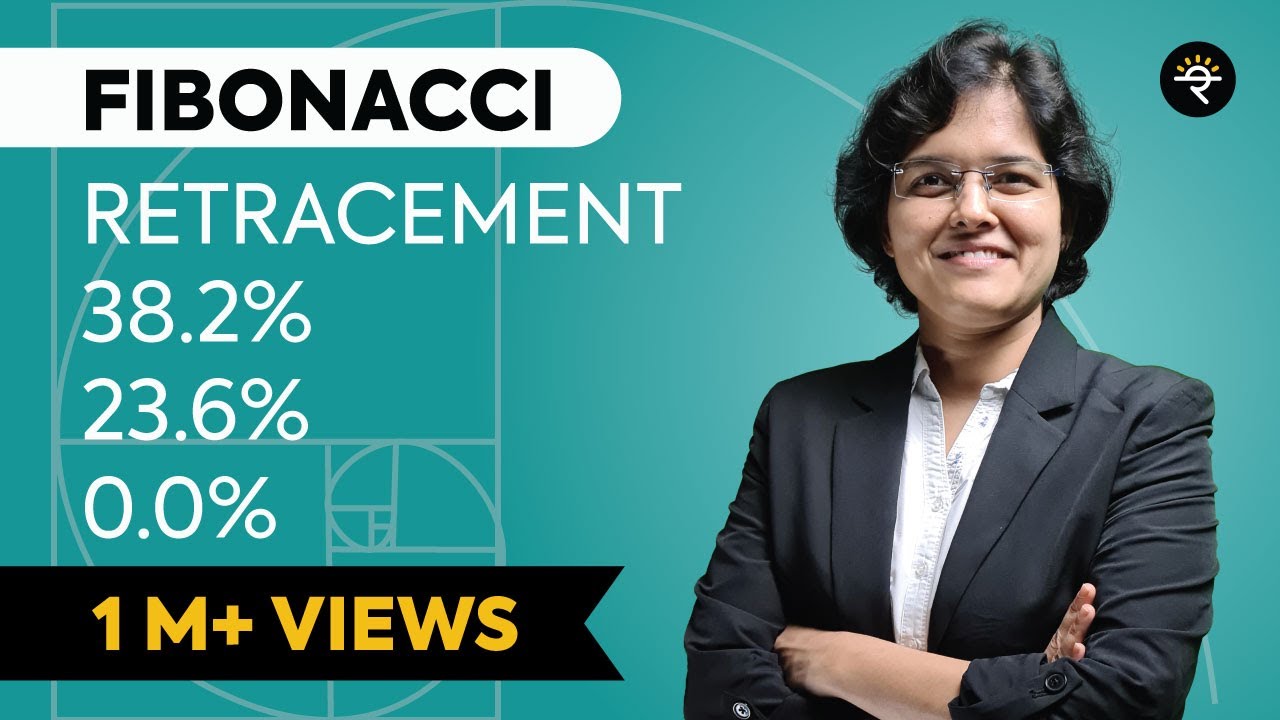
What is Fibonacci Retracement? How to use Fibonacci Retracement in Trading? Explained By CA Rachana
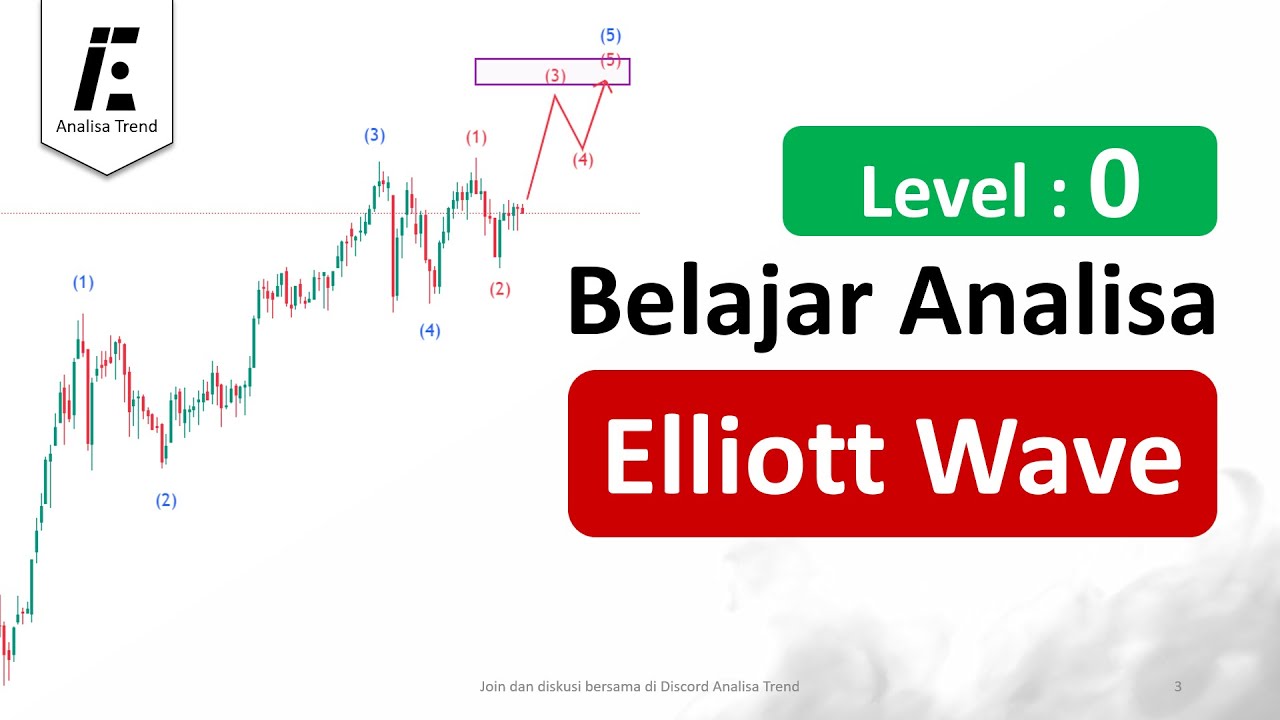
Belajar Analisa Elliott Wave level 0 | mengenal elliott wave

Choosing Dealing Ranges & Displacement Ranges - ICT Concepts

konsep Long And Short Entry Forex
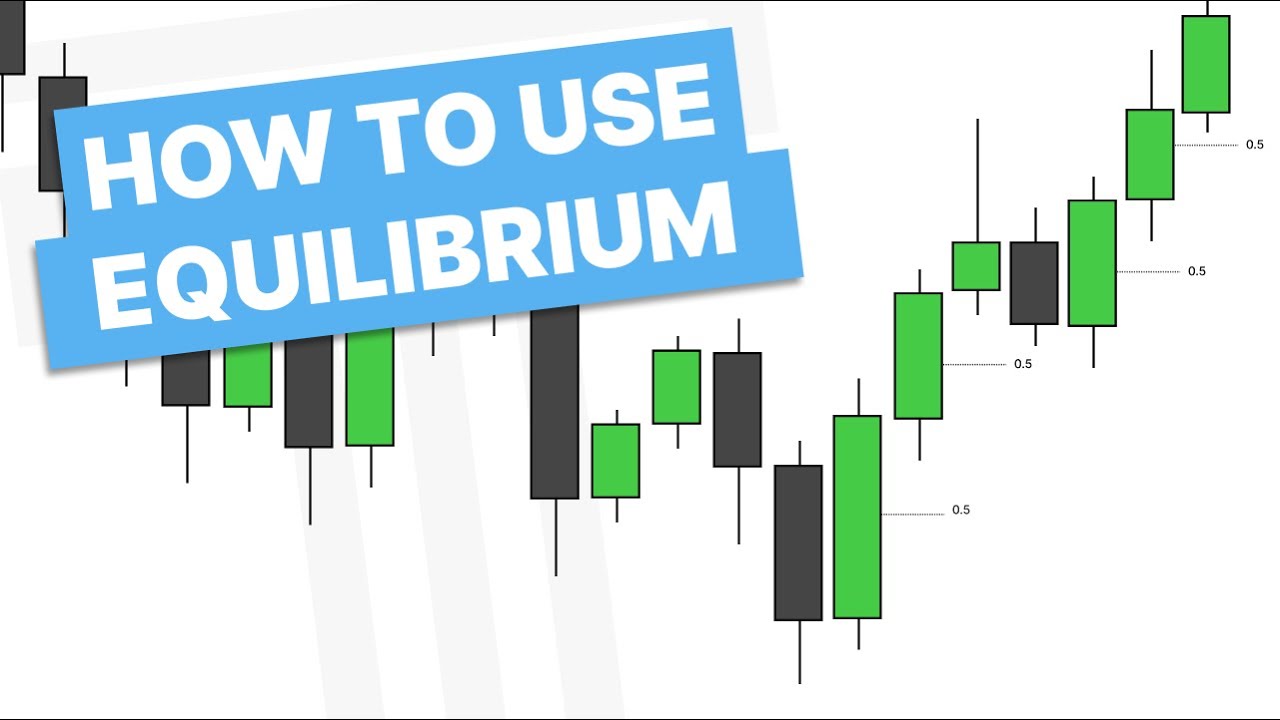
You Are Using Discount and Premium Wrong! - EQ For Expansions
5.0 / 5 (0 votes)