Cartography, Projections and Scales
Summary
TLDRThis video explores essential concepts in cartography, including projections and scales crucial for interpreting navigation charts. It defines cartography, differentiates maps and charts, and delves into various projection types like azimuthal, cylindrical, and conical, explaining their characteristics and uses. The video also covers how projections affect map accuracy and introduces the concept of scale, illustrating how to calculate real distances from map measurements. These insights are valuable for understanding navigation and mapmaking.
Takeaways
- π Cartography is the science of representing the Earth's surface on a 2D surface like paper at a smaller scale.
- πΊοΈ A chart is a specialized type of map designed for a specific purpose, such as navigation for ships or planes.
- π The challenge of cartography lies in accurately representing a 3D figure like the Earth on a 2D surface without distortion.
- π Projections are methods of representing the Earth's surface on a 2D plane, with various types preserving different properties like shape, area, distance, or direction.
- π There is no single projection that can perfectly preserve all characteristics, so choices are made based on the map's purpose.
- π‘ The concept of projection can be visualized by imagining a light bulb inside the Earth projecting its surface onto a surrounding piece of paper.
- π Azimuthal projections have no distortion at the center point and are used to map the poles but are not common for navigation.
- π Cylindrical projections show no distortion along the equator, with increasing distortion away from it, and are useful for direction measurement.
- π Conical projections touch the Earth at two standard parallels, preserving accuracy at these points with distortion increasing away from them.
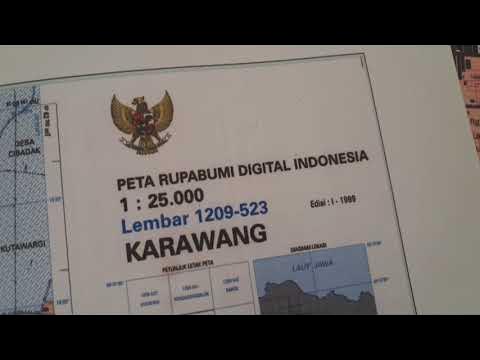
- π’ Scale is the relationship between a map measurement and the actual Earth measurement, essential for maintaining correct proportions.
- π Maps publish their scale in various formats, which can be used to calculate real-world distances without tools like a plotter.
Q & A
What is cartography and where does the word come from?
-Cartography is the science of representing a part or all of the Earth's surface graphically at a smaller scale on a 2D surface such as a piece of paper. The word comes from 'cardo,' meaning map, and 'graph,' meaning to write.
What is the difference between a map and a chart?
-A chart is a specialized type of map that contains information related to a specific purpose, such as nautical charts for sea navigation or aeronautical charts for air navigation.
Why is it difficult to represent the Earth's surface on a 2D plane?
-It is difficult because representing a 3D figure like the Earth on a 2D plane cannot maintain all its proportions, scales, and features accurately. This requires the use of projections that introduce some level of distortion.
What are map projections and why are they important?
-Map projections are methods used to represent the Earth's curved surface on a 2D plane. They are important because they allow us to create maps, but each projection introduces some distortion in shape, area, distance, or direction.
What is a conformal projection and what does it preserve?
-A conformal projection maintains the correct shape of objects and surfaces, ensuring that angles and shapes are preserved accurately.
What does an equivalent projection maintain?
-An equivalent projection maintains the magnitude of the area of objects and surfaces correctly, ensuring that the size of areas is accurate.
What is an azimuthal projection and where is it most accurate?
-An azimuthal projection is a type of map projection where a flat piece of paper touches the Earth at a single point, typically a pole. It is most accurate at the center point where the paper touches the Earth, with distortion increasing as you move away from this point.
What are the characteristics of a cylindrical projection?
-In a cylindrical projection, the map is created by projecting the Earth's surface onto a cylinder. It is most accurate around the equator, with distortion increasing towards the poles. Meridians and parallels intersect at right angles, making it easier to measure direction, but the size of areas can be distorted.
How does a conical projection differ from a cylindrical projection?
-A conical projection involves projecting the Earth's surface onto a cone that touches the Earth along two standard parallels. It preserves accuracy and properties near these parallels, with distortion increasing away from them. Unlike cylindrical projections, it offers a different pattern of distortion suitable for mid-latitude regions.
What is the formula for determining real distance on a map using scale?
-The formula for determining real distance is: Real Distance = Map Distance x Scale. For example, if the map scale is 1:1,000,000 and the map distance is 16 centimeters, the real distance is 16,000,000 centimeters, which can then be converted to other units like nautical miles.
Outlines
πΊοΈ Cartography, Projections, and Scales Overview
This paragraph introduces the fundamental concepts of cartography, which is the science of graphically representing the Earth's surface on a 2D surface like paper at a smaller scale. It explains the difference between a map and a chart, with the latter being a specialized map for specific purposes such as navigation. The paragraph discusses the challenges of accurately representing a 3D Earth on a 2D surface and introduces the concept of map projections, which are methods to project the Earth's surface onto developable shapes like cylinders or cones. It also explains the types of projections based on the properties they preserve, such as conformal, equivalent, equidistant, and azimuthal projections, and acknowledges that no single projection can maintain all properties perfectly.
π Understanding Map Projections and Their Distortions
This paragraph delves deeper into the specifics of different map projections, including azimuthal, cylindrical, and conical projections. It describes how each projection touches the Earth at specific points, resulting in varying degrees of accuracy and distortion. The azimuthal projection is highlighted for its accuracy at the center point and increasing distortion away from it. The cylindrical projection is noted for its accurate representation near the equator and distortion as one moves away from it, exemplified by the incorrect size comparison between Africa and Greenland. The conical projection is explained as having accurate representations at standard parallels with distortion increasing away from these points. The paragraph also touches on the arrangement of projections to map areas accurately and mentions commonly used projections for navigation, such as the Lambert Conformal Conical and the Mercator Conformal Cylindrical.
π The Importance of Scale in Aeronautical Charting
The final paragraph focuses on the concept of scale in aeronautical charting, which is crucial for maintaining correct proportions of terrain and objects. The scale is defined as the ratio of real distance to map distance, and its importance is emphasized for determining distances without a plotter. The paragraph provides examples of how scales are published on maps and demonstrates how to calculate real distances using the scale formula with two different examples. It also explains the unit conversion from centimeters to nautical miles. The summary concludes with the practical use of a plotter for measuring distances and the educational value of understanding scales in navigation.
Mindmap
Keywords
π‘Cartography
π‘Projections
π‘Scale
π‘Map
π‘Chart
π‘Conformality
π‘Equivalent Projection
π‘Equidistant Projection
π‘Azimuthal Projection
π‘Cylindrical Projection
π‘Conical Projection
Highlights
Cartography is the science of graphically representing the earth's surface at a smaller scale on a 2D surface like paper.
A chart is a specialized type of map designed for a specific purpose, such as nautical or aeronautical navigation.
Representing the 3D earth on a 2D surface without distortion is impossible, requiring the use of projections.
Projections are attempts to represent the earth's surface on developable shapes like cylinders or cones for 2D representation.
Different projections preserve different properties such as shape, area, distance, or direction.
No single projection can preserve all properties simultaneously, necessitating a choice based on the map's purpose.
Projections can be visualized as the earth's surface being projected onto paper wrapped around it.
Azimuthal projections have no distortion at the center point but increasing distortion away from it.
Cylindrical projections show no distortion at the equator and increasing distortion towards the poles.
Conical projections have accurate scale and shape at standard parallels but distort size away from these points.
Projections can be arranged differently to map specific areas accurately, depending on the region's characteristics.
Commonly used navigation projections include the Lambert Conformal Conic and the Mercator Conformal Cylindrical.
Air navigation charts focus on small areas to minimize distortion for specific flights, requiring multiple charts.
Scale is the relationship between a map measurement and the actual earth measurement, calculated as real distance divided by map distance.
Maps publish their scale in various formats, aiding in determining distances without specialized tools.
Examples are provided to demonstrate how to calculate real distances using map scales and rulers.
Understanding scale is crucial for accurate navigation and interpretation of map measurements.
The video concludes with an encouragement to share, like, subscribe, and comment for further engagement.
Transcripts
today we will talk about cartography
projections and scales which are
essential concepts for the proper
interpretation of navigation charts
so let's start by defining cartography
this word comes from cardo which means
map and graph which means right and it
is the science of representing a part or
all of the earth's surface graphically
at a smaller scale in a 2d surface such
as a piece of paper
this graphic representation obtained is
called a map
but why do we sometimes say map and
sometimes chart
well a chart is actually a type of map
let's look at this in more detail
in general terms a chart is a
specialized map which contains
information related to a particular
purpose
for example a nautical chart will show
information such as seed depth
lighthouses ports and so forth since its
purpose is to assist the navigation of
ships
however in the case of aviation an
aeronautical chart is a map adapted to
the needs of air navigation which
contains detailed relevant information
on the most important aspects such as
obstacles navaids airports air spaces
etc
now with this being said when we try to
create a map or chart that correctly
represents the surface of the earth we
run into a big problem and it is that
representing a 3d figure such as the
earth in a 2d surface is extremely
complicated
since it is impossible to represent the
earth on a 2d plane maintaining all its
proportions scales and features
correctly
however we can try to get as close to
perfection as possible
to try to do this the earth's surface
must be projected into shapes that can
actually be represented in a 2d surface
such as cylinders or cones which are
developable surfaces
now all these attempts to represent the
earth in different shapes are known as
projections and there are a lot of
them each projection receives its name
depending on its characteristics and the
properties it preserves
for example a conformal projection
maintains the correct shape of objects
and surfaces
an equivalent projection maintains the
magnitude of the area of objects and
surfaces correctly
an equidistant projection maintains the
ratio of the distance between two
objects or surfaces correctly
and an azimuthal projection maintains
the direction between two objects or
surfaces correctly
now although it would be great to be
able to include all of these features on
the same map there is no existing
projection that preserves all of these
characteristics at the same time
so it must be decided which of these
features is more important to include in
the map depending on its purpose
now to understand better how a
projection is developed it can be
described as putting a light bulb in the
center of the earth in a piece of paper
around the planet
then when the light bulb is turned on
the surface of the earth is projected
onto the piece of paper becoming a map
this way the resulting map will depend
on how the paper is placed around the
earth and that is why there are
different types of projections
now an important thing regarding this is
that in all types of projections there
is one or more points where the paper
touches the surface of the earth and as
a general rule these points where the
projection touches the surface are the
most accurate and precise in terms of
scale distance direction shape etc and
as we move away from these points the
map begins to distort
so with this being said let's take a
look at the most commonly used
projections starting with the azimuthal
projection
it consists of a flat piece of paper
that touches the earth at one of its
poles as we can see in this images
the main characteristics of an azimuthal
projection is that near the center point
there is no distortion the magnitude of
the distortion increases as we move away
from the center point and direction and
distance can only be measured correctly
from the center point
this projection is often used to map the
poles but is not commonly used for
navigation
now the next one is the cylindrical
projection which consists of a piece of
paper that is folded into a cylinder
shape and touches the earth around the
equator as we can see in these images
in this case the projection touches the
earth around the entire equator line
therefore the main characteristics of
this cylindrical projection are that
near the equator there is no distortion
the magnitude of the distortion
increases as we move away from the
equator
meridians in parallels intersect at 90
degrees angles making it easier to
measure direction and it shows the
shapes correctly but the size is
distorted
a clear example of this is the
representation of africa and greenland
here we can clearly see that in reality
africa is much bigger than greenland
however because of the distortion of
this cylindrical projection it looks
like it is almost the same size
finally there is the conical projection
which consists of a piece of paper that
is folded into a cone shape and touches
the surface in two particular parallels
which are known as standard parallels as
we can see in these images
in this case since there are two points
at which the projection touches the
surface in both of them the
characteristics and properties are
accurate and correctly preserved giving
as a result this pattern of distortion
now the main characteristics of this
conical projection are that near the
standard parallels there is no
distortion the magnitude of the
distortion increases as we move away
from these standard parallels and it
shows the shapes correctly but the size
is distorted just like in the
cylindrical projection
here we can see an example of how a map
is developed using this conical
projection
finally something important to mention
is that a projection can be arranged in
different ways depending on the area to
be mapped accurately as we can see in
these examples
now regarding the names of the
projections they consist of a
combination of their creator their main
characteristic and technique used for
example the most used projections for
navigation are the lambert conformal
conical and the mercator conformal
cylindrical
in these cases to avoid excessive
distortion the charts used for air
navigation focus on relatively small
specific areas
and therefore for a certain flight
several charts may be required
let's now move on to the scale
on an aeronautical chart it is important
that the proportions of terrain and
objects are correctly maintained
and the scale is the relationship
between a measurement on the map or
chart and the actual measurement on the
earth
and its formula is very simple it is
real distance divided by the map
distance
now all maps publish the scale with
which they were designed and this can be
found in different formats
for example they can publish a numerical
scale or a graphic scale or even a plain
text scale
here we can see some examples of how the
scale is published on a map
this information is really useful when
we have to determine distances on a map
without a plotter
let's see an example of how to do this
let's say we have this chart with a
scale of one in one million and we want
to determine the distance between the
towns of germania and miraflores
however we don't have a plotter so we
have to use a regular ruler that
measures centimeters
according to this we measure a distance
on the map of 16 centimeters
so now the question is with this
information how can we determine the
real distance between these towns
well we have to use the scale formula
which is real distance divided by map
distance
right now we know the scale and the map
distance so we just have to rearrange
the formula to determine the real
distance which in this case is 16
million centimeters
with this we already know the real
distance but it is in centimeters so we
must convert units to nautical miles
obtaining as a result a distance of 86.4
nautical miles
in this example we used a map with a
scale of one in one million
let's see now another example but now
with a scale of 1 in hundred and fifty
thousand
in this case we want to determine the
real distance between the towns of san
jose and esmeralda which are twelve
centimeters apart on the map
so to do this we use the previous
formula to determine the real distance
which in this case is 3 million
centimeters
then we convert units to get nautical
miles obtaining as a result a real
distance of 16.2 nautical miles between
san jose and esmeralda
now normally we have available a plotter
graduated with statute and nautical
miles so we don't have to do this
procedure
however it helps to understand the
concept of scale
i hope the information presented in this
video was useful
if so don't forget to share like
subscribe and leave a comment down below
thanks for watching
[Music]
5.0 / 5 (0 votes)