Menyajikan Data dalam Bentuk Diagram Lingkaran
Summary
TLDRThis educational mathematics lesson focuses on presenting data using circle diagrams (pie charts). The instructor demonstrates how to represent blood donation data for various blood groups (A, B, AB, O) by calculating their angles and percentages. Step-by-step instructions are provided on how to convert the data into a circle diagram using a compass, protractor, and clear measurements. The video encourages student participation by assigning tasks to convert additional datasets into circle diagrams, helping students visualize data in a clear and engaging way.
Takeaways
- 😀 The lesson is about data processing, focusing on presenting data in different formats such as tables, diagrams, and now, circle diagrams.
- 😀 A table is provided with blood donation data from PMI, including blood groups A, B, AB, and O with respective numbers.
- 😀 To create a circle diagram, first, sum up all the data. In this case, 70 (A) + 63 (B) + 35 (AB) + 112 (O) = 280.
- 😀 The next step is to calculate the angle for each blood group, with the formula: (individual value / total value) * 360°.
- 😀 For blood group A, the angle is calculated as 70/280 * 360°, which equals 90°.
- 😀 For blood group B, the angle is 63/280 * 360°, which equals 81°.
- 😀 For blood group AB, the angle is 35/280 * 360°, which equals 45°.
- 😀 For blood group O, the angle is 112/280 * 360°, which equals 144°.
- 😀 The next step involves calculating percentages for each blood group by multiplying the individual value by 100% and dividing by the total value.
- 😀 The percentages are: Blood group A = 25%, Blood group B = 22.5%, Blood group AB = 12.5%, and Blood group O = 40%.
- 😀 Finally, the script shows the process of drawing the circle diagram using tools like a compass and protractor, and marking the angles to represent each blood group proportionally.
Q & A
What topic is being taught in the video?
-The topic being taught is data processing, specifically how to present data in various forms such as tables, diagrams, and circle charts (pie charts).
What type of data is used in the example for presenting in a circle diagram?
-The example uses data from blood donations, with categories based on blood types: A, B, AB, and O.
How do you calculate the total of all the data in the example?
-To calculate the total, add up the numbers for each blood type: 70 (A) + 63 (B) + 35 (AB) + 112 (O) = 280.
How do you find the angle for each section of the pie chart?
-To find the angle, you divide the number for each blood type by the total data (280) and then multiply by 360° (the total angle in a circle).
What is the formula used to calculate the angle for blood type A?
-The formula for calculating the angle for blood type A is: (70/280) * 360° = 90°.
What is the percentage of blood type B in the data?
-The percentage of blood type B is calculated as (63/280) * 100% = 22.5%.
How do you convert the data into percentages?
-To convert the data into percentages, you divide the number for each blood type by the total and multiply by 100%.
What tools are used to draw the circle diagram?
-The tools used are a compass (for drawing the circle), a protractor (for measuring angles), and a pencil.
How do you use the protractor to measure the angles for the pie chart?
-You place the protractor’s center at the center of the circle, align the baseline with the zero point, and measure the corresponding angle for each blood type (e.g., 90°, 81°, etc.).
What is the significance of drawing the circle correctly before marking the angles?
-Drawing the circle correctly ensures that all angles are proportional and correctly placed, which is essential for creating an accurate pie chart.
Outlines

This section is available to paid users only. Please upgrade to access this part.
Upgrade NowMindmap

This section is available to paid users only. Please upgrade to access this part.
Upgrade NowKeywords

This section is available to paid users only. Please upgrade to access this part.
Upgrade NowHighlights

This section is available to paid users only. Please upgrade to access this part.
Upgrade NowTranscripts

This section is available to paid users only. Please upgrade to access this part.
Upgrade NowBrowse More Related Video

PENYAJIAN DATA DALAM BENTUK TABEL & DIAGRAM || PENGOLAHAN DATA
Penyajian Data (Part-1) ~ Tabel dan Diagram (Materi PJJ Kelas VII / 7 SMP)
Kurikulum Merdeka Materi Matematika Kelas 7 Bab 6 Data dan Diagram
Statistik#1 : Diagram | Kelas X Fase E Kurikulum Merdeka
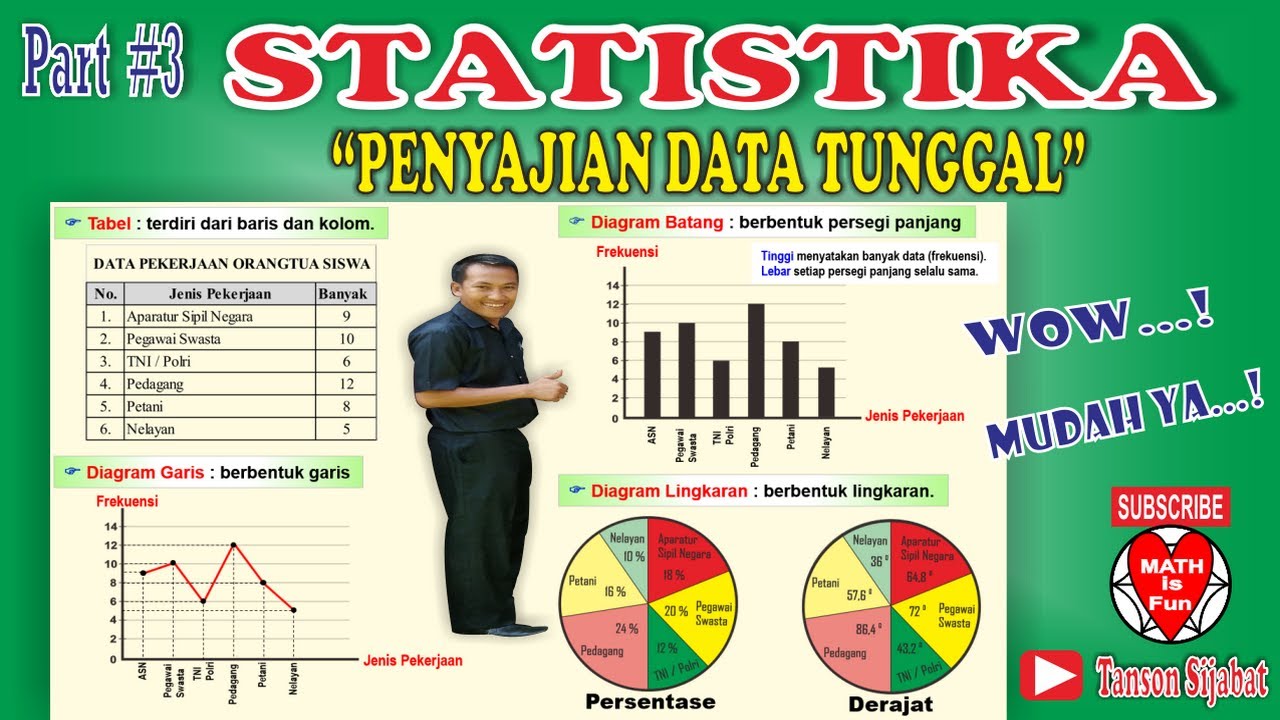
STATISTIKA | PENYAJIAN DATA TUNGGAL [Tabel, Diagram Garis, Diagram Batang, Lingkaran]

[1] Penyajian Data (Tabel)
5.0 / 5 (0 votes)