Poin Penting Regresi 2 IV (2)
Summary
TLDRIn this video, the speaker provides a detailed explanation of multiple regression analysis with two independent variables (2IV). The content focuses on the regression equation, the calculation of coefficients (B1, B2, and A), and how to compute R-squared. The speaker also covers the significance testing of regression results using F-tests and t-tests. Additionally, practical tips are shared on using Excel to simplify calculations. The video is designed to help viewers understand the technical aspects of regression analysis, focusing on formula application and interpretation in a clear and concise manner.
Takeaways
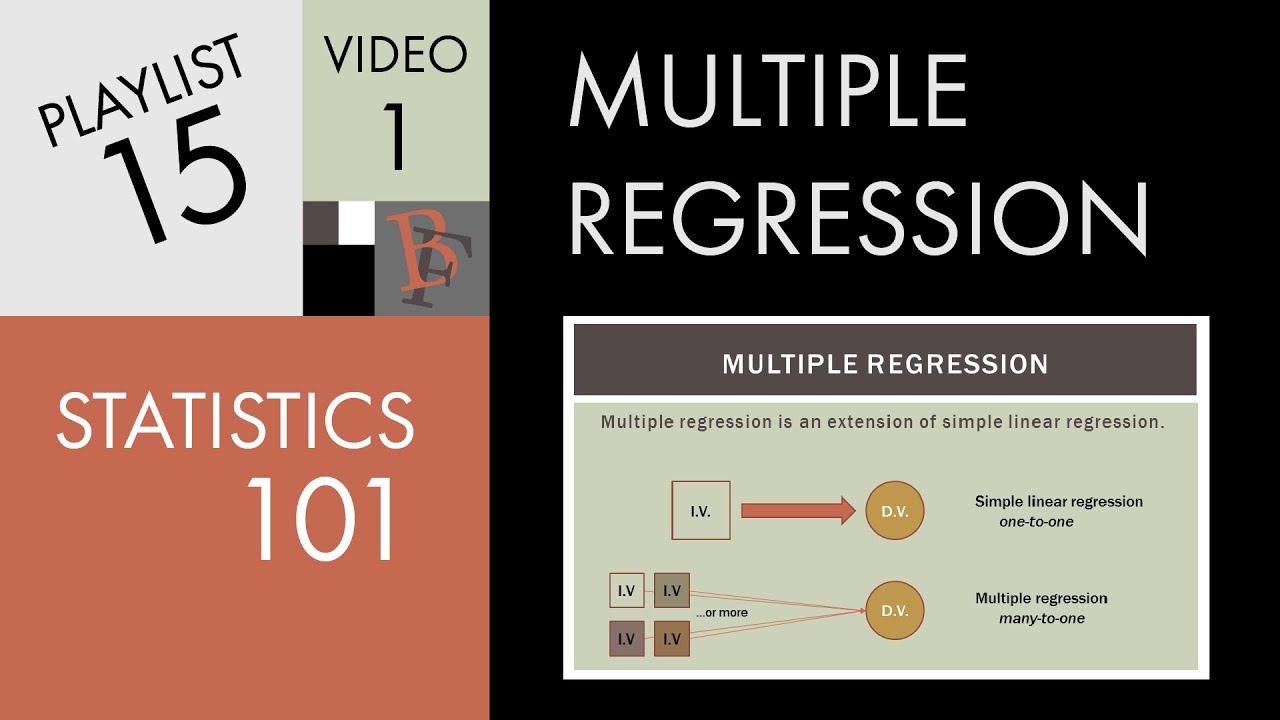
- 😀 Regression equation with two independent variables (2IV) is: y = a + b1*x1 + b2*x2 + ε.
- 😀 Parameters in the regression equation include the intercept (a) and the coefficients (b1 and b2) for each independent variable.
- 😀 To calculate the regression coefficients (b1, b2, a), various formulas involving summations and cross-products of variables are used.
- 😀 While manual calculation of the coefficients is possible, using Excel simplifies the process and aids in performing necessary calculations efficiently.
- 😀 R-squared (R²) measures the proportion of variance in the dependent variable explained by the independent variables in the regression model.
- 😀 The significance of the entire regression model is tested using the F-test, which determines if the model is statistically significant.
- 😀 T-tests are used to test the significance of individual coefficients (b1, b2), assessing whether each independent variable significantly influences the dependent variable.
- 😀 The p-value is crucial for determining the significance of the regression coefficients, with lower p-values indicating stronger significance.
- 😀 Beta coefficients (β1, β2) are used to understand the relative impact of each independent variable on the dependent variable. They are calculated by standardizing the regression coefficients.
- 😀 Excel can be used to compute essential sums and cross-products, making the calculation of regression coefficients and statistical tests more efficient.
- 😀 It is not necessary to memorize all the formulas; understanding how to use them in practice and applying them with tools like Excel is more important for successful regression analysis.
Q & A
What is the general regression equation discussed in the script?
-The general regression equation discussed is Y = a + B1*X1 + B2*X2 + e, where Y is the dependent variable, X1 and X2 are independent variables, B1 and B2 are their respective coefficients, a is the intercept, and e is the error term.
How do you calculate the parameters B1, B2, and a in multiple linear regression?
-B1 and B2 are calculated using specific formulas involving sums and cross-products of the independent variables (X1, X2) and the dependent variable (Y). The intercept 'a' is computed as the mean of Y minus the sum of B1*X1 mean and B2*X2 mean.
Why is Excel suggested for calculating the regression parameters?
-Excel is recommended because it simplifies the calculation process, especially for large datasets. It allows users to apply formulas quickly without manual computation of complex sums and cross-products.
What does R-squared (R²) represent in regression analysis?
-R-squared represents the proportion of the variance in the dependent variable (Y) that is explained by the independent variables (X1 and X2). A higher R² value indicates a better fit of the regression model to the data.
How is R-squared calculated?
-R-squared is calculated by dividing the explained variance (SSReg) by the total variance (SSTotal) in the dependent variable.
What is the purpose of the F-test in regression analysis?
-The F-test is used to assess the overall significance of the regression model. It tests whether at least one of the independent variables significantly explains the variation in the dependent variable.
How does the F-test differ in simple linear regression and multiple regression (2IFI)?
-In simple linear regression, the F-test only considers the contribution of one independent variable. In multiple regression (2IFI), the F-test accounts for the combined contribution of two independent variables, X1 and X2.
What is the T-test used for in regression analysis?
-The T-test is used to test the significance of individual regression coefficients (B1 and B2) to determine if each independent variable has a statistically significant relationship with the dependent variable.
What does the Beta coefficient represent, and how is it calculated?
-The Beta coefficient represents the standardized effect of each independent variable on the dependent variable. It is calculated by multiplying the unstandardized coefficient (B1 or B2) by the standard deviation of the independent variable and dividing by the standard deviation of the dependent variable.
Why is it unnecessary to memorize all the formulas discussed in the video?
-It is not necessary to memorize all the formulas because the key is understanding how to apply them. Tools like Excel can help automate many of the calculations, making it easier to perform regression analysis without manually computing every step.
Outlines

This section is available to paid users only. Please upgrade to access this part.
Upgrade NowMindmap

This section is available to paid users only. Please upgrade to access this part.
Upgrade NowKeywords

This section is available to paid users only. Please upgrade to access this part.
Upgrade NowHighlights

This section is available to paid users only. Please upgrade to access this part.
Upgrade NowTranscripts

This section is available to paid users only. Please upgrade to access this part.
Upgrade NowBrowse More Related Video
Modul 12 (StatSos2) - Konsep Dasar Regresi Linear Sederhana

(1/4) Analisis Regresi : Uji asumsi Klasik

REGRESI DENGAN DUMMY VARIABEL DUA KATEGORI Oleh Agus Tri Basuki Part 1
Statistics 101: Multiple Linear Regression, The Very Basics 📈

Penjelasan Singkat Analisis Regresi (Linier) dengan Variabel Dikotomi

ANOVA vs Regression
5.0 / 5 (0 votes)