ANOVA vs Regression
Summary
TLDRThis video explores the similarities and differences between ANOVA and regression, two statistical methods that analyze variation. While both use sums of squares, they serve different purposes: ANOVA determines if there's a significant difference between group means, akin to a t-test, and is used with categorical independent variables. Regression, however, aims to create a predictive model, establishing a cause-and-effect relationship with numerical independent and dependent variables. The video clarifies these concepts through a detailed comparison and examples, emphasizing their unique applications in statistical analysis.
Takeaways
- 📚 The video is part of a series on 'ANOVA and Related Concepts', aiming to clarify confusing statistical concepts based on the speaker's book.
- 🔍 The focus of this video is to compare ANOVA with regression, highlighting their similarities and differences.
- 📊 ANOVA and regression both analyze variation using sums of squares, but they do so in fundamentally different ways due to the nature of the questions they aim to answer.
- ❓ ANOVA is used to determine if there are statistically significant differences between group means, similar to the t-test but for more than two groups.
- 🏠 Regression analysis aims to create a predictive model that establishes a cause-and-effect relationship between independent and dependent variables.
- 📏 In ANOVA, the independent variable must be categorical (e.g., drug names), while in regression, both the independent and dependent variables are numerical (e.g., number of bedrooms and house price).
- 🧩 The total variation in ANOVA is partitioned into 'within' and 'between' groups, whereas in regression, it's partitioned into 'regression' and 'error' components.
- 📈 The video explains how to calculate the sum of squares total (SST), sum of squares within (SSW), and sum of squares between (SSB) for ANOVA, and sum of squares total (SST), sum of squares regression (SSR), and sum of squares error (SSE) for regression.
- 📊 ANOVA uses the F-test to determine significance, comparing mean squares between groups (MSB) to mean squares within groups (MSW).
- 📈 Regression uses R-squared to measure the goodness of fit, which is the ratio of SSR to SST, indicating how well the regression line explains the variation in the data.
- 🔗 The video emphasizes the different purposes of ANOVA and regression, with ANOVA being more suitable for designed experiments and regression for inferential statistics and predictive modeling.
Q & A
What is the main purpose of ANOVA?
-ANOVA is used to determine whether there is a statistically significant difference between the means of two or more populations. It is more similar to the t-test than to regression, especially when comparing just two populations.
How does the purpose of regression differ from ANOVA?
-Regression aims to produce a model, typically in the form of a formula for a regression line or curve, which can be used to predict the values of the dependent variable (Y) given values of one or more independent variables (X). It attempts to establish a cause-and-effect relationship, unlike ANOVA which focuses on mean differences.
What are the requirements for the independent variable in ANOVA?
-In ANOVA, the independent variable must be categorical, meaning it should be nominal categories such as names or labels, not numerical values.
What type of variables does regression require for both the independent and dependent variables?
-Regression requires both the independent variable (X) and the dependent variable (Y) to be numerical, allowing for the calculation of a cause-and-effect relationship through a mathematical model.
How do ANOVA and regression analyze variation?
-Both ANOVA and regression analyze variation by partitioning the total variation into components using sums of squares. However, the types of variation they analyze are different due to the nature of the questions they aim to answer.
What are the two components of the total sum of squares (SST) in ANOVA?
-In ANOVA, the total sum of squares (SST) is partitioned into the sum of squares within (SSW) and the sum of squares between (SSB), representing the variation within groups and between group means, respectively.
How is the sum of squares total (SST) for regression calculated?
-In regression, the sum of squares total (SST) is calculated as the sum of the squared deviations of the data values of the dependent variable (Y) from its mean.
What is the significance of the ratio of sum of squares regression (SSR) to sum of squares total (SST) in regression?
-The ratio of SSR to SST in regression is known as R-squared, which measures the goodness of fit of the regression line. It indicates the proportion of the total variation in Y that is explained by the regression model.
How does ANOVA use the F-test to determine statistical significance?
-ANOVA uses the F-test by dividing the sum of squares between (SSB) by its degrees of freedom to get the mean sum of squares between (MSB), and similarly for the sum of squares within (SSW) to get MSW. The F-test statistic is then calculated by dividing MSB by MSW, and compared to a critical value to determine significance.
What is the primary use of ANOVA in experimental design?
-ANOVA is well-suited for designed experiments where levels of the independent variable can be controlled, such as testing the effects of specific dosages of drugs.
How does regression use inferential statistics to provide a cause-and-effect model?
-Regression uses inferential statistics to draw conclusions about a population based on sample data, providing a formula for the best-fit regression line or curve that predicts Y values from X values, which can then be validated through further experiments or data collection.
Outlines

This section is available to paid users only. Please upgrade to access this part.
Upgrade NowMindmap

This section is available to paid users only. Please upgrade to access this part.
Upgrade NowKeywords

This section is available to paid users only. Please upgrade to access this part.
Upgrade NowHighlights

This section is available to paid users only. Please upgrade to access this part.
Upgrade NowTranscripts

This section is available to paid users only. Please upgrade to access this part.
Upgrade NowBrowse More Related Video
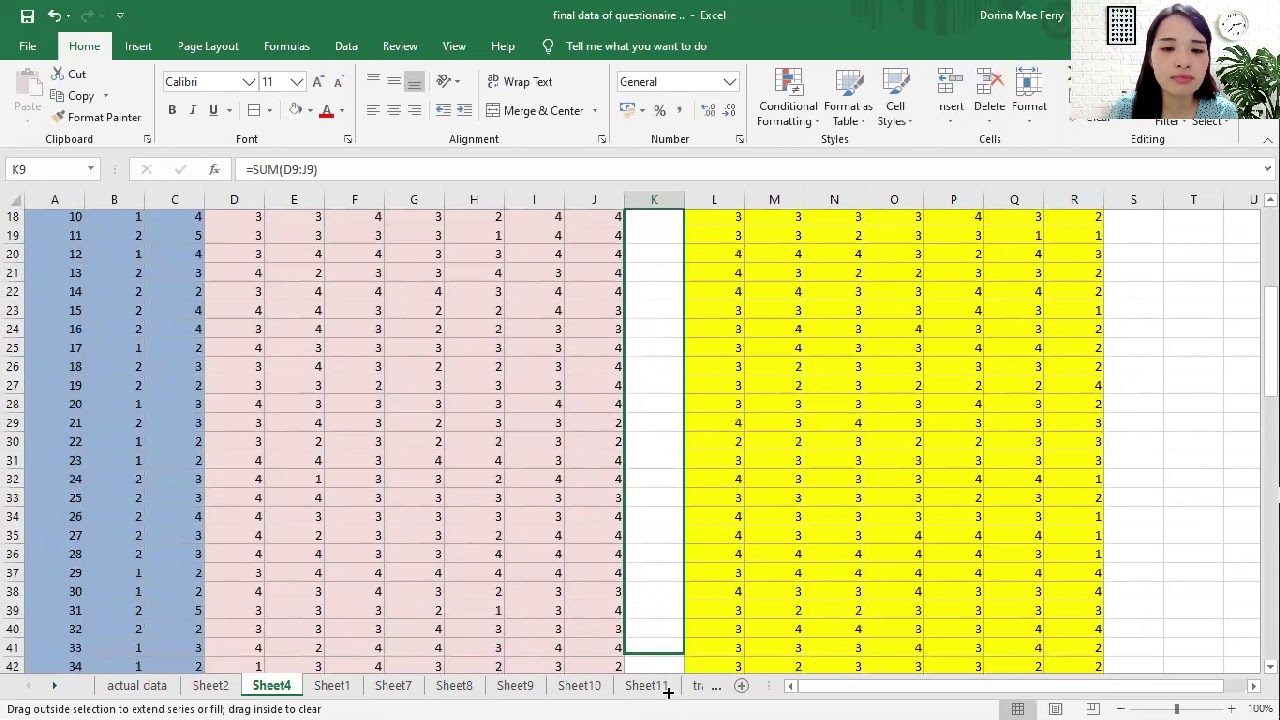
How to Tally, Encode, and Analyze your Data using Microsoft Excel (Chapter 4: Quantitative Research)

The Secret Weapons of Research: Statistical Tools Revealed
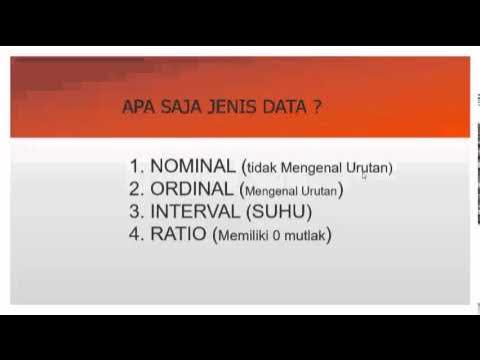
statistika dasar | pengantar statistik

PERBEDAAN UJI REGRESI LOGISTIK DAN UJI REGRESI LINEAR | PENJELASAN MUDAH DIPAHAMI MAHASISWA
ANOVA: Crash Course Statistics #33

REGRESI DENGAN DUMMY VARIABEL LEBIH DARI 2 KATEGORI Oleh Agus Tri Basuki Part 2
5.0 / 5 (0 votes)