Distribución de probabilidad : Binomial
Summary
TLDRThis video script explains the fundamentals of probability distributions, focusing primarily on the binomial distribution for discrete variables. It covers how each distribution assigns probabilities to outcomes, explaining key concepts like expected value, standard deviation, and how these distributions are applied in real-world scenarios. The script also demonstrates how to use Excel for calculating binomial probabilities, offering practical examples such as predicting the likelihood of clients complaining about defective products or tourists staying with a tour group. The step-by-step instructions make the complex topic more accessible for learners.
Takeaways
- 😀 The concept of probability distributions is essential for understanding statistical models and making predictions in experiments.
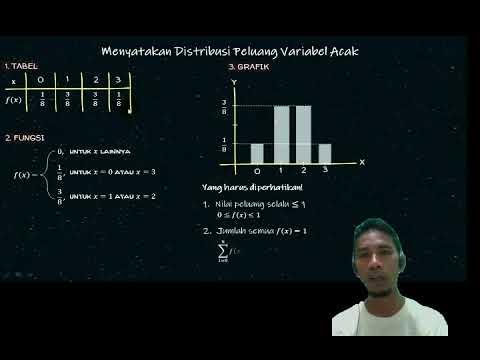
- 😀 Probability distributions are functions that assign probabilities to each possible value of a variable, similar to frequency distributions.
- 😀 A probability distribution assigns probabilities to values of both discrete and continuous variables, with different models for each type.
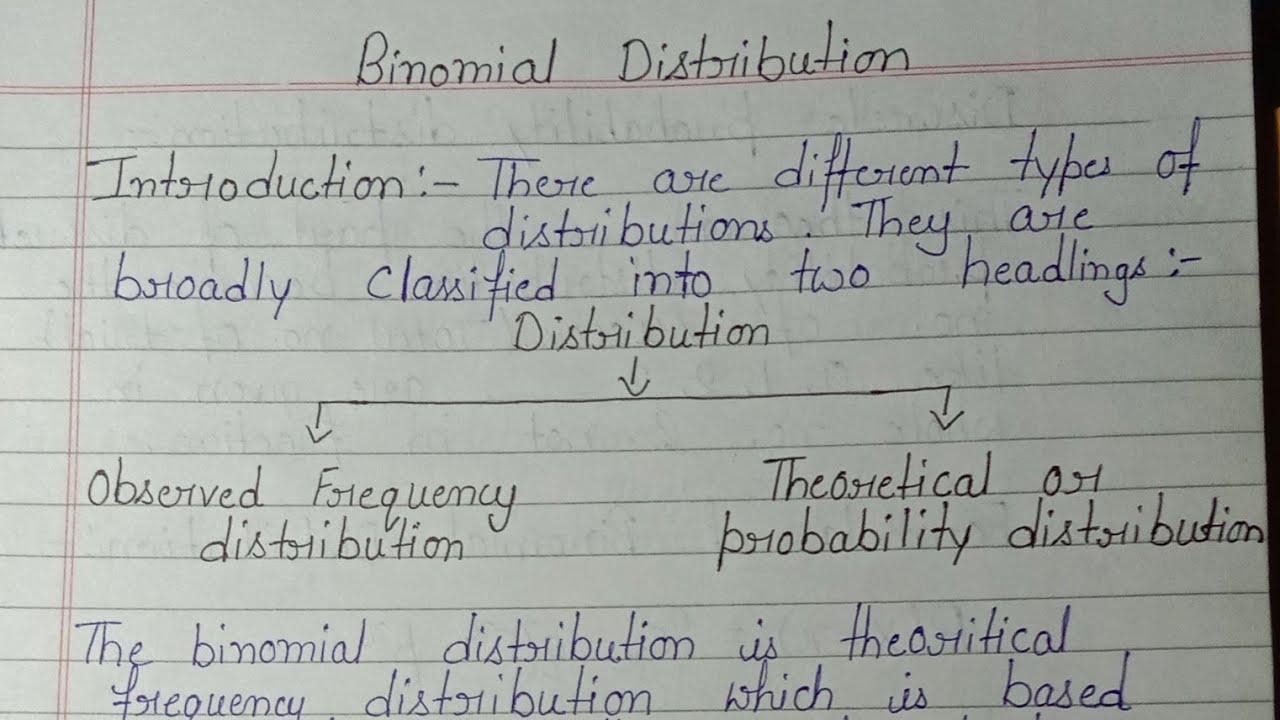
- 😀 Discrete variables are analyzed using models like binomial, hypergeometric, and Poisson distributions.
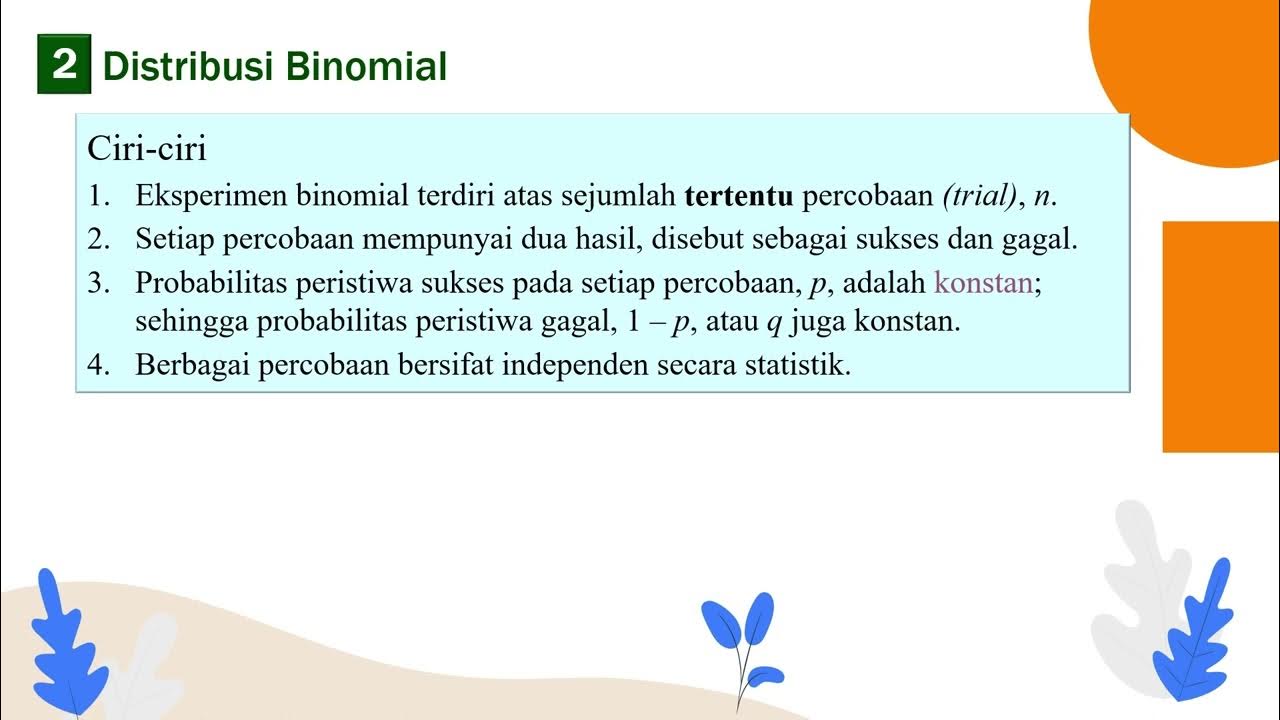
- 😀 The binomial distribution is used for experiments with only two possible outcomes, such as success or failure.
- 😀 The probability of success (p) and failure (q) in a binomial experiment sum to 1, where q = 1 - p.
- 😀 In a binomial distribution, we focus on the number of successes (x) in a given number of trials (n).
- 😀 The expected value (mean) in a binomial distribution is calculated by multiplying the number of trials by the probability of success (n * p).
- 😀 The standard deviation of a binomial distribution measures the variability of successes around the expected value, calculated as √(n * p * q).
- 😀 Excel can be used to calculate probabilities for binomial distributions using the `BINOM.DIST` function, which returns the probability of exactly x successes in n trials.
Q & A
What is a probability distribution?
-A probability distribution is a function that assigns probabilities to each possible value of a random variable. In the context of this script, it refers to how probabilities are assigned to values in a discrete or continuous variable, similar to how frequency distributions assign frequencies to values.
What is the relationship between frequency distributions and probability distributions?
-Probability distributions are closely linked to frequency distributions. In a frequency distribution, each value of a variable is assigned a frequency. Similarly, in a probability distribution, each value is assigned its probability of occurrence. The main difference is that frequencies are counts, while probabilities are proportions or chances of occurrence.
What are the two types of variables discussed in the script?
-The two types of variables discussed are quantitative variables (which can be discrete or continuous) and qualitative (categorical) variables. Quantitative variables represent numerical values, while qualitative variables represent categories or attributes.
What is a binomial distribution, and when is it used?
-A binomial distribution is used for experiments with two possible outcomes, typically labeled success or failure. It is applicable for discrete variables and is used when the experiment involves multiple independent trials with a fixed probability of success in each trial.
How is the binomial distribution applied in real-life examples?
-In real-life, binomial distributions are used in scenarios where outcomes are binary. For example, whether a product is defective or not, or whether a customer will make a complaint. The number of successes (such as complaints or defective products) is what we are interested in calculating.
What does the formula for the binomial distribution involve?
-The formula for the binomial distribution involves the number of trials (n), the number of successes (x), the probability of success (p), and the probability of failure (q). The general formula is: P(X = x) = C(n, x) * p^x * q^(n-x), where C(n, x) is the combination of n trials taken x at a time.
What is the significance of the expected value and standard deviation in probability distributions?
-The expected value represents the average outcome of an experiment after many repetitions. In a probability distribution, it is the weighted sum of each outcome, where each outcome is weighted by its probability. The standard deviation measures how spread out the values are from the expected value, indicating the variability in the outcomes.
How do you calculate probabilities using Excel for a binomial distribution?
-In Excel, you can use the function BINOM.DIST to calculate probabilities for binomial distributions. By inputting the number of successes (x), the total number of trials (n), and the probability of success (p), you can find the probability of exactly x successes. You can also set the 'cumulative' argument to true for cumulative probabilities (less than or equal to x) or false for exact probabilities.
In the given example, how do you calculate the probability that three out of seven clients will complain?
-To calculate the probability that exactly three out of seven clients will complain, we use Excel's BINOM.DIST function. With a probability of success (p) of 0.125 (12.5%), and n = 7 trials, the probability is calculated using BINOM.DIST(3, 7, 0.125, FALSE), which returns a value of approximately 4.01%.
What does 'at least two' mean in the context of binomial probability, and how is it calculated?
-In the context of binomial probability, 'at least two' means that the number of successes is greater than or equal to two. To calculate this, you can find the probability of having fewer than two successes and subtract it from 1. In Excel, this can be done using BINOM.DIST with a cumulative argument set to TRUE for the value '2' and then subtracting the result from 1 to get the probability of having two or more successes.
Outlines

This section is available to paid users only. Please upgrade to access this part.
Upgrade NowMindmap

This section is available to paid users only. Please upgrade to access this part.
Upgrade NowKeywords

This section is available to paid users only. Please upgrade to access this part.
Upgrade NowHighlights

This section is available to paid users only. Please upgrade to access this part.
Upgrade NowTranscripts

This section is available to paid users only. Please upgrade to access this part.
Upgrade NowBrowse More Related Video

Pertemuan 1 - Distribusi Probabilitas (Part 2)
materi matematika peminatan K13
Sesi 5 3 Distribusi Probabilitas Bagian 3
Types Of Distribution In Statistics | Probability Distribution Explained | Statistics | Simplilearn

Probability Distribution Functions (PMF, PDF, CDF)
Binomial distribution # Explanation with notes# Properties of binomial distribution.
5.0 / 5 (0 votes)