VISUALISASI DATA DAN TEKNIK INTERPRETASI
Summary
TLDRIn this session on Design Thinking, the instructor covers key aspects of data visualization and interpretation techniques. Starting with the 'Define' phase, the focus is on synthesizing gathered data into actionable insights, which are then visualized through various methods like empathy mapping, mind mapping, and affinity diagrams. The instructor emphasizes the importance of empathy, intuition, and recognizing patterns in data to understand the real needs of consumers. The session also delves into techniques such as the Fishbone diagram and Conceptual maps to identify problems and solutions. Practical application of these methods is highlighted for future use in design projects.
Takeaways
- 😀 The importance of data visualization and interpretation in the design thinking process is emphasized as a key step after defining the problem.
- 😀 Data visualization involves converting data into graphical formats like charts and images to make it easier to understand and analyze.
- 😀 The 'Define' stage of design thinking focuses on summarizing and identifying the main problems based on gathered data before moving forward with solutions.
- 😀 Empathy is critical in the interpretive phase; understanding and deeply analyzing user needs is essential for generating meaningful insights.
- 😀 Different techniques such as empathy mapping, mind mapping, affinity diagrams, and cause-and-effect diagrams are discussed to help visualize and interpret data.
- 😀 Affinity diagrams, a method popularized by Japanese anthropologist Jiro Kawakita, are useful for brainstorming and organizing findings into related groups.
- 😀 The affinity diagram process involves using sticky notes to collect ideas, sort them into categories, and label those categories for clarity.
- 😀 The Fishbone diagram (also known as the Ishikawa diagram) is a structured method used to analyze the root causes of problems in a detailed way, particularly in business contexts.
- 😀 Conceptual maps help visually organize complex concepts, while mind maps are focused on keywords and short phrases, often used for creative or brainstorming purposes.
- 😀 Blueprinting is a method for creating detailed frameworks for developing strategies, policies, and operational plans for achieving organizational goals.
- 😀 Empathy, pattern recognition, and intuition are key skills for successfully interpreting data and defining problems in the design thinking process.
Q & A
What is the main focus of the session described in the transcript?
-The session focuses on data visualization and interpretation techniques, particularly in the context of design thinking. It covers how to visualize data collected during research and interpret it to generate insights that guide problem-solving.
What is the importance of data visualization in design thinking?
-Data visualization is crucial in design thinking because it helps teams organize and interpret complex data into more understandable and actionable insights. It makes the findings from research clearer, allowing for better decision-making and problem-solving.
What is the 'Define' phase in design thinking?
-The 'Define' phase in design thinking involves synthesizing and summarizing the key insights from the data collected in the previous 'Empathize' phase. It helps clarify the core problems and challenges that need to be addressed.
What are some of the techniques used for data visualization and interpretation mentioned in the script?
-Some techniques mentioned include empathy mapping, mind mapping, journey mapping, affinity diagrams, cause-and-effect diagrams, and conceptual maps. These methods help organize and analyze the data to uncover insights.
What is an affinity diagram, and how is it used?
-An affinity diagram is a method used to organize ideas and findings into groups based on natural relationships. It is often used during brainstorming sessions to cluster data and identify patterns or insights. This process helps in defining problems and generating solutions.
What does the term 'KJ Method' refer to in relation to affinity diagrams?
-The 'KJ Method' is another name for the affinity diagram technique, named after the Japanese anthropologist Jiro Kawakita. It emphasizes the use of brainstorming and organizing ideas into related groups to gain insights into the data.
What is a cause-and-effect diagram, and how does it help in problem-solving?
-A cause-and-effect diagram, also known as a fishbone diagram, helps identify the root causes of a problem by breaking it down into categories such as materials, environment, people, and processes. It is used to analyze the relationships between different factors contributing to an issue.
How does a conceptual map differ from a mind map?
-A conceptual map focuses on understanding the relationships between concepts and often includes detailed explanations. In contrast, a mind map is more visual and centers around keywords or phrases that capture the essence of concepts, aiding in quick recall and idea generation.
Why is intuition important in the interpretation phase of design thinking?
-Intuition is essential in the interpretation phase because it helps designers understand deeper meanings behind consumer responses. It allows for the recognition of patterns and insights that may not be immediately obvious from surface-level data.
What role does empathy play in the interpretation phase of design thinking?
-Empathy plays a central role in the interpretation phase because it enables the designer to deeply understand the needs, desires, and emotions of the consumers. It helps in identifying the real problems and not just what is superficially expressed.
Outlines

This section is available to paid users only. Please upgrade to access this part.
Upgrade NowMindmap

This section is available to paid users only. Please upgrade to access this part.
Upgrade NowKeywords

This section is available to paid users only. Please upgrade to access this part.
Upgrade NowHighlights

This section is available to paid users only. Please upgrade to access this part.
Upgrade NowTranscripts

This section is available to paid users only. Please upgrade to access this part.
Upgrade NowBrowse More Related Video

PSD - Data Visualization Part.01/02
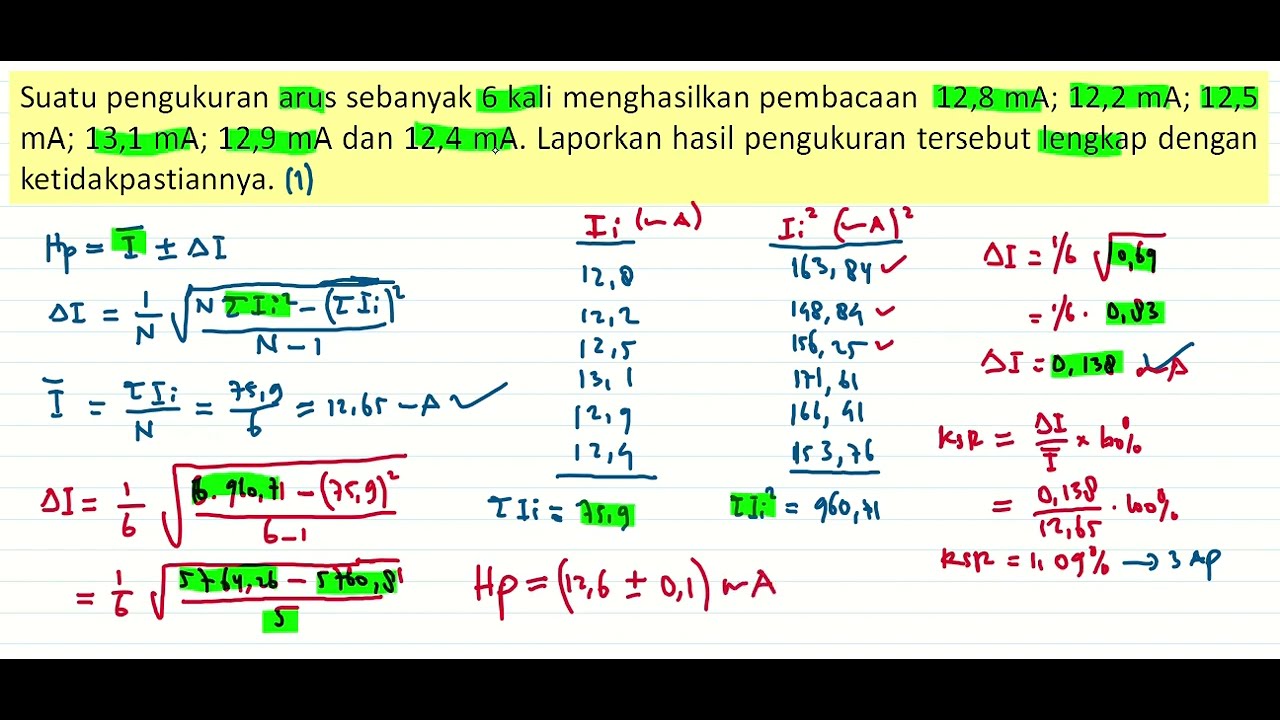
Pengukuran Berulang: Ketidakpastian Mutlak, Ketidakpastian Relatif | Contoh Soal
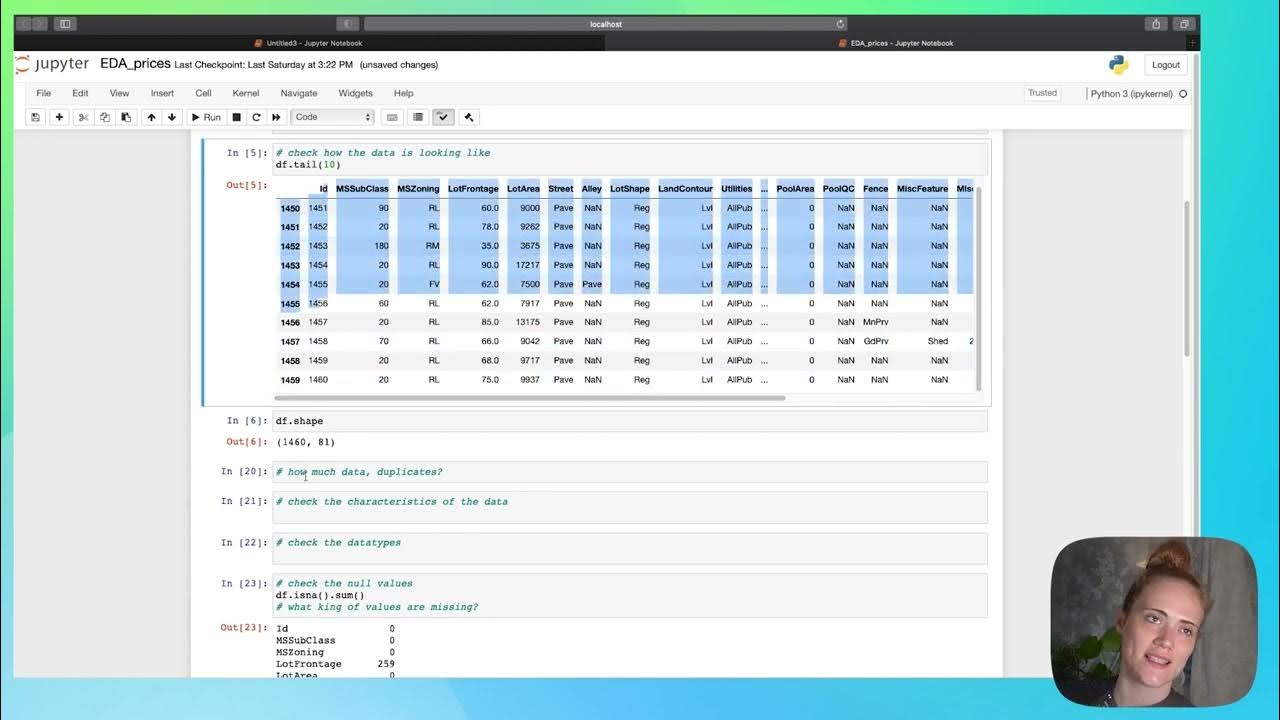
EDA - part 1

Lecture 04: Pitfalls of data science framework and Basics of data visualization

Investigasi Statistika Hal 185-193 Bab 6 DATA DAN DIAGRAM kelas 7 SMP Kurikulum Merdeka

Data Visualization Techniques | Data Visualization Techniques and Tools | Data Visualization Trends
5.0 / 5 (0 votes)