Cara Tetap Profit di Kondisi Sulit || Strategi Support Resistance + 50% Order Block SMC
Summary
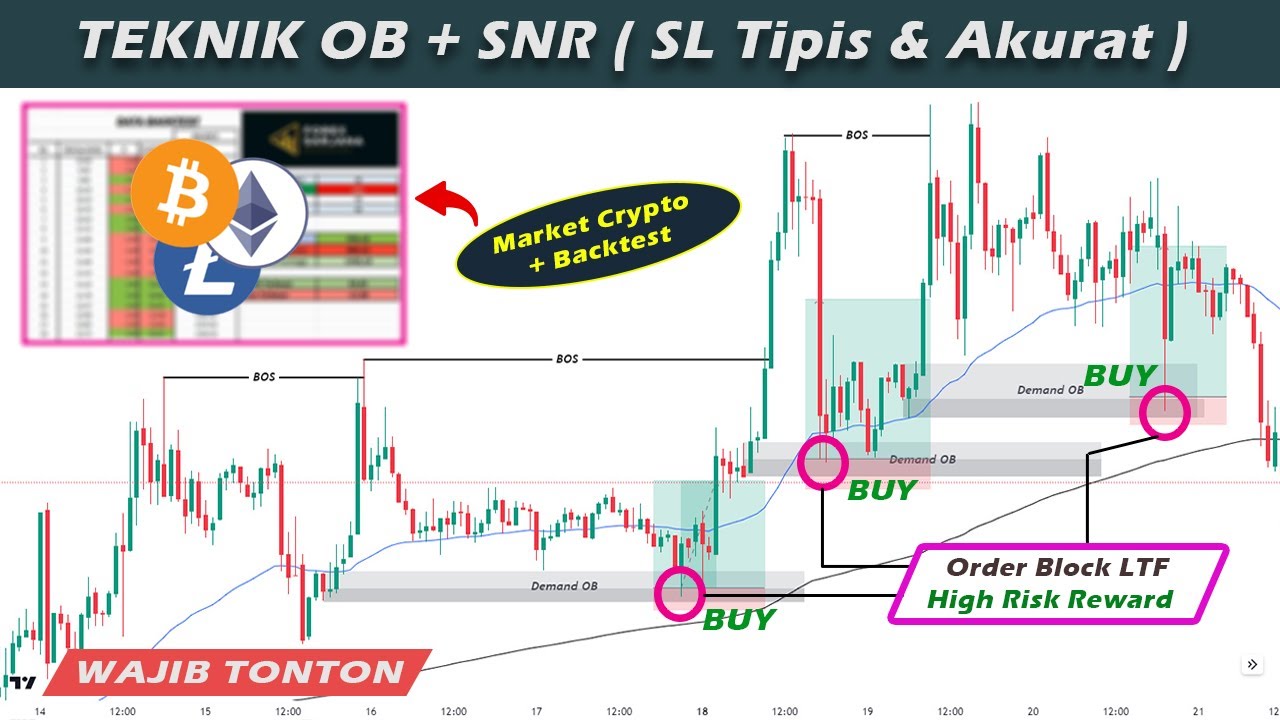
TLDRIn this video, the trader shares a strategy for entering the market with high probability trades using supply and demand zones (Support and Resistance). By identifying key support and resistance levels, traders can spot high-quality setups for buy and sell entries. The video covers how to use price structure, Order Blocks, and the concept of Change of Character (COC) to refine entry points. With a focus on tight stop losses and a fixed risk-to-reward ratio, the trader demonstrates how to implement this strategy with proper risk management, highlighting the importance of confirmation across multiple timeframes for accurate entries.
Takeaways
- 😀 Understand the importance of buying at support zones (demand) and selling at resistance zones (supply) for successful trading.
- 😀 Support zones are identified when prices stop falling and reverse upwards, indicating strong demand from buyers.
- 😀 Resistance zones are identified when prices stop rising and reverse downwards, indicating strong supply from sellers.
- 😀 Support and resistance zones are not always reliable; additional confirmation is needed before entering trades.
- 😀 Use Change of Character (CHoC) and Break of Structure (BoS) to identify market reversals and trend continuation.
- 😀 CHoC occurs when price breaks above a previous lower high in a downtrend or below a higher low in an uptrend.
- 😀 BoS indicates trend continuation when price breaks below a previous low in a downtrend or above a previous high in an uptrend.
- 😀 Entry is based on order blocks, placed at 50% of the order block zone for more precise entries and tighter stop losses.
- 😀 Stop loss should be placed at the edge of the order block, adjusted by half the Average True Range (ATR) and spread.
- 😀 Use multiple timeframes to confirm the trend direction (e.g., H1, H4, M15) and ensure alignment with market conditions.
- 😀 EMA 50 above EMA 200 signals an uptrend; EMA 50 below EMA 200 signals a downtrend, guiding the choice of support or resistance zones for entries.
- 😀 Fractal indicators can help identify market structure and make it easier to spot changes in market direction on lower timeframes.
- 😀 The strategy is focused on high probability trades using strict rules, minimizing risk, and aiming for a favorable risk-to-reward ratio (e.g., 5R).
- 😀 Traders should avoid entering trades that go against the prevailing trend, as these are typically lower probability setups.
- 😀 The method provides opportunities to profit even from small price reactions in volatile markets, but discipline and patience are essential.
Q & A
What is the basic concept behind the trading strategy discussed in the video?
-The basic concept involves buying at low price zones (demand areas) and selling at high price zones (supply areas). Support and resistance zones are key to identifying these levels, where support represents demand zones and resistance represents supply zones.
What are support and resistance zones in trading, and why are they important?
-Support zones are price levels where a downtrend stops and reverses due to significant buying interest, while resistance zones are levels where an uptrend halts and reverses due to significant selling interest. They are important because they represent price levels where traders expect price reversals or continuations.
Why can’t traders simply buy at support and sell at resistance without additional analysis?
-Not all support or resistance zones lead to price reactions. Traders need to look for specific high-probability zones and entry methods that involve careful analysis, such as using order blocks and momentum indicators, to increase the likelihood of profitable trades.
What is the role of order blocks in this trading strategy?
-Order blocks are identified as the last candle before an impulsive price movement. Traders use order blocks to define entry points, with the 50% level of the order block acting as a more precise entry to minimize stop loss and maximize potential reward.
What is 'Change of Character' (COC), and how does it affect trade decisions?
-Change of Character (COC) refers to a shift in market structure that signals a potential reversal in market direction. It occurs when a market breaks above a previous lower high in a downtrend or below a higher low in an uptrend, indicating a momentum shift. COC helps traders confirm the change before entering a trade.
How do traders use time frames to confirm entries in this strategy?
-Traders use multiple time frames to confirm the trend and entry points. For example, if the trend is identified on a higher time frame (e.g., H1), traders zoom into a lower time frame (e.g., M5) to find a precise entry point at an order block, ensuring the trade aligns with the overall trend.
What is the significance of the EMA 50 and EMA 200 in this strategy?
-The EMA 50 and EMA 200 help determine the market trend. When EMA 50 is above EMA 200, the market is considered in an uptrend, and traders should focus on buying at support. When EMA 50 is below EMA 200, the market is in a downtrend, and traders should focus on selling at resistance.
What is the role of the Fractal indicator in this strategy?
-The Fractal indicator is used to identify swing highs and swing lows on lower time frames, helping traders spot the market structure and accurately determine the points for Change of Character (COC) or Break of Structure (BOS), which are essential for validating entry points.
How does the Average True Range (ATR) assist in determining stop loss levels?
-ATR helps calculate the market's volatility, and traders use it to adjust their stop loss placement. For instance, when setting a stop loss for a buy position, the ATR value is subtracted from the lower boundary of the order block, while for a sell position, it is added to the upper boundary.
What is the importance of following the strategy rules in this trading approach?
-Following the strategy rules ensures that trades are executed in high-probability scenarios, minimizing risk and increasing the chances of profitable outcomes. Deviating from the rules, such as entering a buy during a downtrend or vice versa, can lead to invalid trades and potential losses.
Outlines

This section is available to paid users only. Please upgrade to access this part.
Upgrade NowMindmap

This section is available to paid users only. Please upgrade to access this part.
Upgrade NowKeywords

This section is available to paid users only. Please upgrade to access this part.
Upgrade NowHighlights

This section is available to paid users only. Please upgrade to access this part.
Upgrade NowTranscripts

This section is available to paid users only. Please upgrade to access this part.
Upgrade NowBrowse More Related Video

Master Supply & Demand Trading (ULTIMATE In-Depth Guide)

How to Understand Multi-Timeframe Market Structure - MUST WATCH | SMC | FOREX [Part 2]

$435 Profit -Simple Price action setup even a beginner can make $$ Money $$ - Trusted spots
Teknik Agresif Order Block + Konfirmasi SNR || SL Tipis & Sangat Akurat || + Backtest Market Crypto

EXPOSED - ICT’s Favorite Trading Strategy (Hear it From ICT Himself)

The One Trading Strategy That Works Everyday ( Stupid Simple And Proven)
5.0 / 5 (0 votes)