Belajar Machine Learning - #03.2 Cos Function | Linear Regression
Summary
TLDRIn this video, Imam explains the concept of the cost function in machine learning, specifically in linear regression. He covers how the cost function measures the error between predicted values and actual values, helping to optimize model parameters. Through an example with house prices and areas, Imam demonstrates how to calculate the cost function manually and visualize the results. He also shows how to implement the cost function using Python, emphasizing the importance of minimizing the cost for better model accuracy. The video concludes with a preview of the next topic, gradient descent.
Takeaways
- 😀 The video introduces the concept of the Cost Function in machine learning, specifically in the context of Linear Regression.
- 😀 Cost Function is used to measure the error between predicted values and actual values in machine learning algorithms.
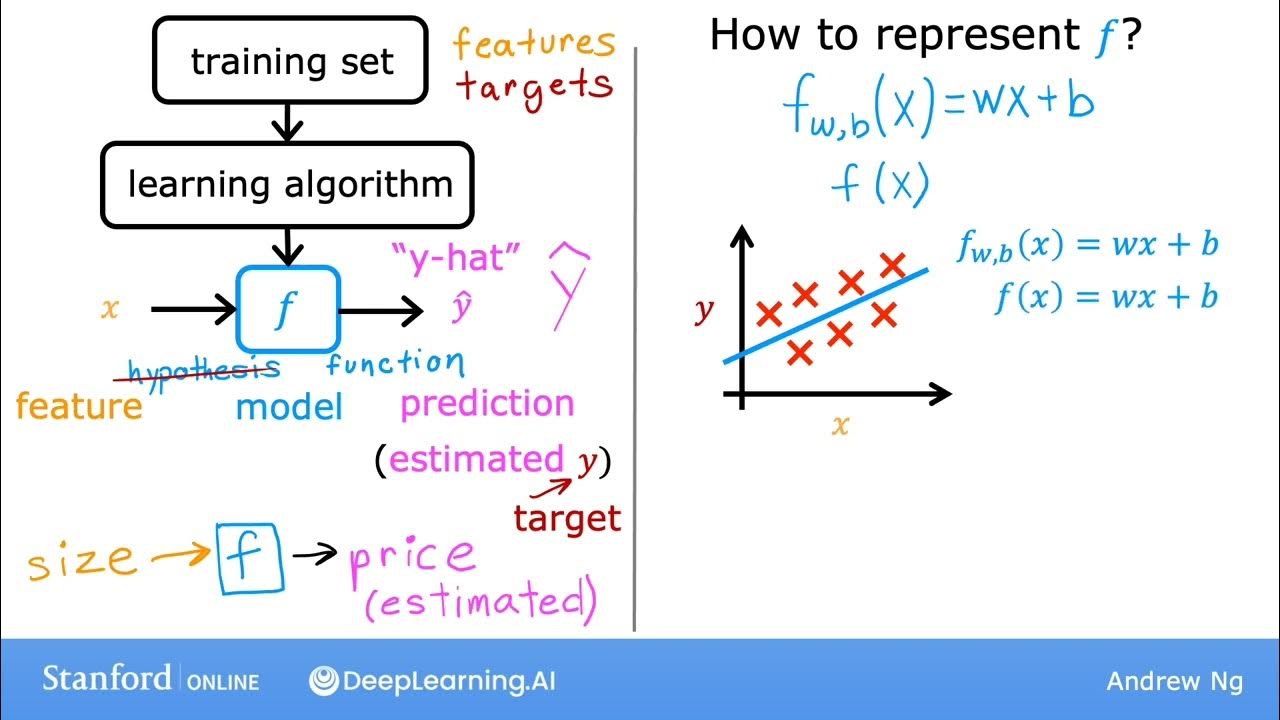
- 😀 Linear Regression involves finding the relationship between input variables (X) and output variables (Y) using a linear equation: y = wx + b.
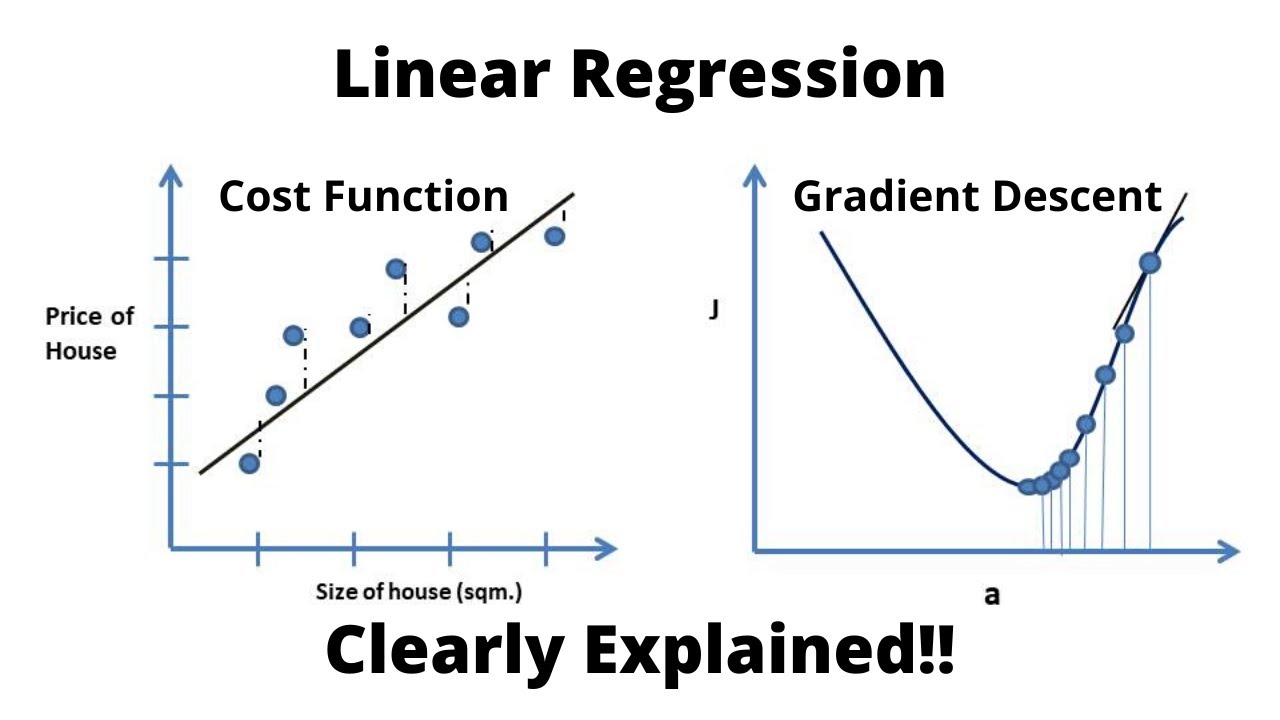
- 😀 The goal of Linear Regression is to minimize the error, which is measured by the Cost Function.
- 😀 Imam explains the importance of the parameters W (weight) and B (bias) in determining the best-fit line for the data.
- 😀 The video demonstrates how to calculate the error using different linear equations and determines the one with the least error using the Cost Function.
- 😀 The formula for the Cost Function is: J(w, b) = (1/2m) * Σ(f(x_i) - y_i)^2, where f(x_i) is the predicted value and y_i is the actual value.
- 😀 The Python implementation is shown, where the Cost Function is computed iteratively to find the optimal values of W and B.
- 😀 The Cost Function helps identify the model that best fits the data by minimizing the error, as shown through examples with house price data and square footage.
- 😀 Imam mentions that in the next video, the topic of Gradient Descent will be covered, a method used to minimize the Cost Function.
Q & A
What is a cost function in machine learning?
-A cost function is used to measure the error in a machine learning model. It calculates how far off the model's predictions are from the actual data, and the goal is to minimize this error during training.
Why is a cost function important in linear regression?
-In linear regression, the cost function helps evaluate how well the linear model (defined by weights 'W' and bias 'B') fits the data. By minimizing the cost function, the model parameters are adjusted to provide the best possible predictions.
What are the parameters used in the linear regression equation?
-In linear regression, the parameters are 'W' (weights) and 'B' (bias). The equation is represented as y = W * X + B, where 'X' is the input feature, and 'y' is the predicted output.
How does the cost function help in finding the best linear model?
-The cost function helps by calculating the error for different values of 'W' and 'B'. The values that minimize the cost function correspond to the best-fitting line for the given data.
What is the formula for the cost function in linear regression?
-The formula for the cost function is: J(W, B) = (1/2m) * Σ (h(x_i) - y_i)^2, where m is the number of data points, h(x_i) is the predicted value (W * X + B), and y_i is the actual value.
How do you calculate the total error using the cost function?
-To calculate the total error, you subtract the predicted value from the actual value for each data point, square the result, and sum these squared errors. The total error is the average of these squared differences.
Why is the gradient descent method mentioned in the script?
-Gradient descent is mentioned as the next step after understanding the cost function. It is a technique used to minimize the cost function by iteratively adjusting the values of 'W' and 'B' to reduce the error.
What does the value 'W = 180' and 'B = 100' represent in the example?
-In the example, 'W = 180' and 'B = 100' are the values of the weight and bias that minimize the cost function for the given data. These values are used to make predictions for the house prices based on the input size.
What is the significance of visualizing the data in the script?
-Visualizing the data helps to understand the relationship between the features (house size) and the target variable (house price). It also helps to visually identify how well the linear regression model fits the data and guides the selection of the optimal values for W and B.
How is Python used to calculate the cost function in the script?
-Python is used to automate the calculation of the cost function by defining variables for 'W', 'B', and the data. The script calculates the predicted values, computes the errors, and sums them up using a loop to minimize the cost function.
Outlines

This section is available to paid users only. Please upgrade to access this part.
Upgrade NowMindmap

This section is available to paid users only. Please upgrade to access this part.
Upgrade NowKeywords

This section is available to paid users only. Please upgrade to access this part.
Upgrade NowHighlights

This section is available to paid users only. Please upgrade to access this part.
Upgrade NowTranscripts

This section is available to paid users only. Please upgrade to access this part.
Upgrade NowBrowse More Related Video
Linear Regression, Cost Function and Gradient Descent Algorithm..Clearly Explained !!
#10 Machine Learning Specialization [Course 1, Week 1, Lesson 3]

3. Learning untuk Klasifikasi dari MACHINE LEARNING

Regulaziation in Machine Learning | L1 and L2 Regularization | Data Science | Edureka

4. Binary Cross Entropy
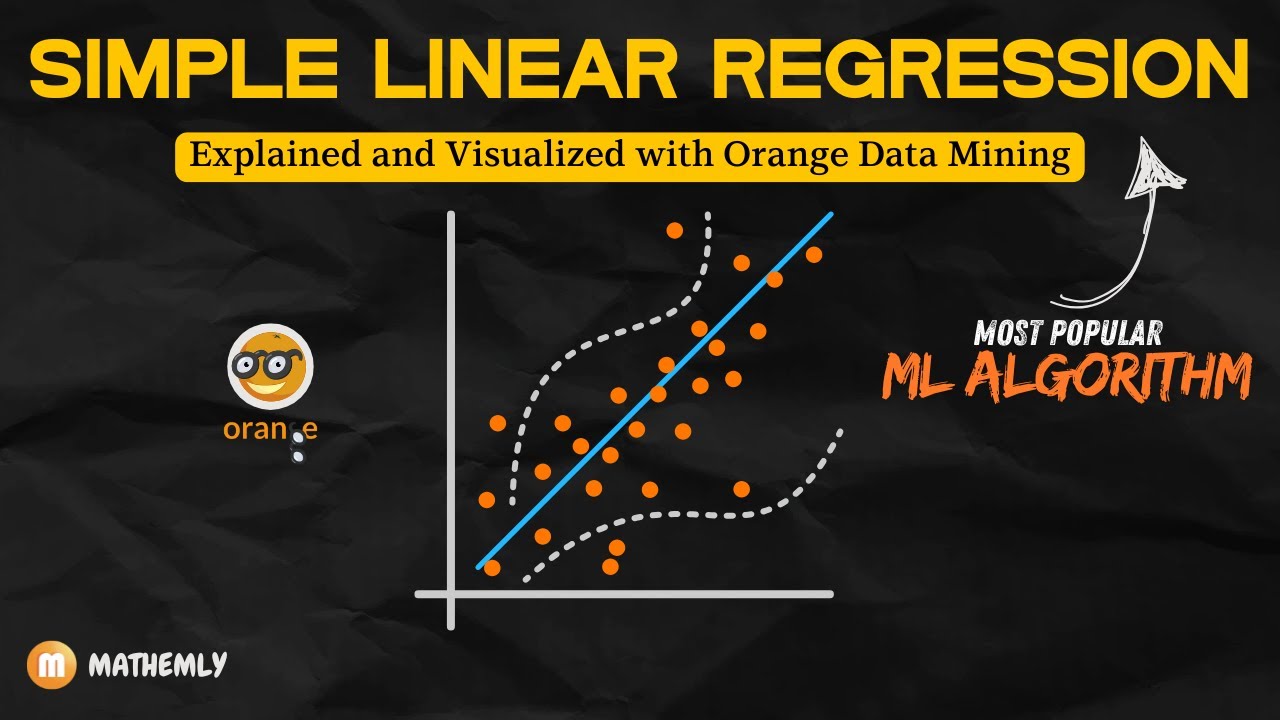
Simple Linear Regression Simplified | Orange Data Mining Tutorial
5.0 / 5 (0 votes)