Sesi 5 4 Distribusi Probabilitas Bagian 4
Summary
TLDRThis video focuses on the binomial probability distribution, explaining its application in quality control through a sampling process. It walks through the setup of a binomial experiment, with 50 trials and a success probability of 0.01, illustrating how to calculate probabilities for various outcomes using tables and Excel functions. The video also explores advanced topics like the complement rule and cumulative probabilities. By the end, users are guided on using Excel's `BINOM.DIST` and `BINOM.DIST.RANGE` functions to simplify probability calculations, setting the stage for an upcoming discussion on the Poisson distribution.
Takeaways
- 😀 Binomial distribution is used to model the probability of having defective or non-defective products in a sample of 50 products.
- 😀 The probability of finding a defective product in the sample is 0.01, which is the same as the probability of getting heads in an unbalanced coin toss.
- 😀 Sampling without replacement from a large population does not significantly change the probability, as the sample size is small compared to the population size.
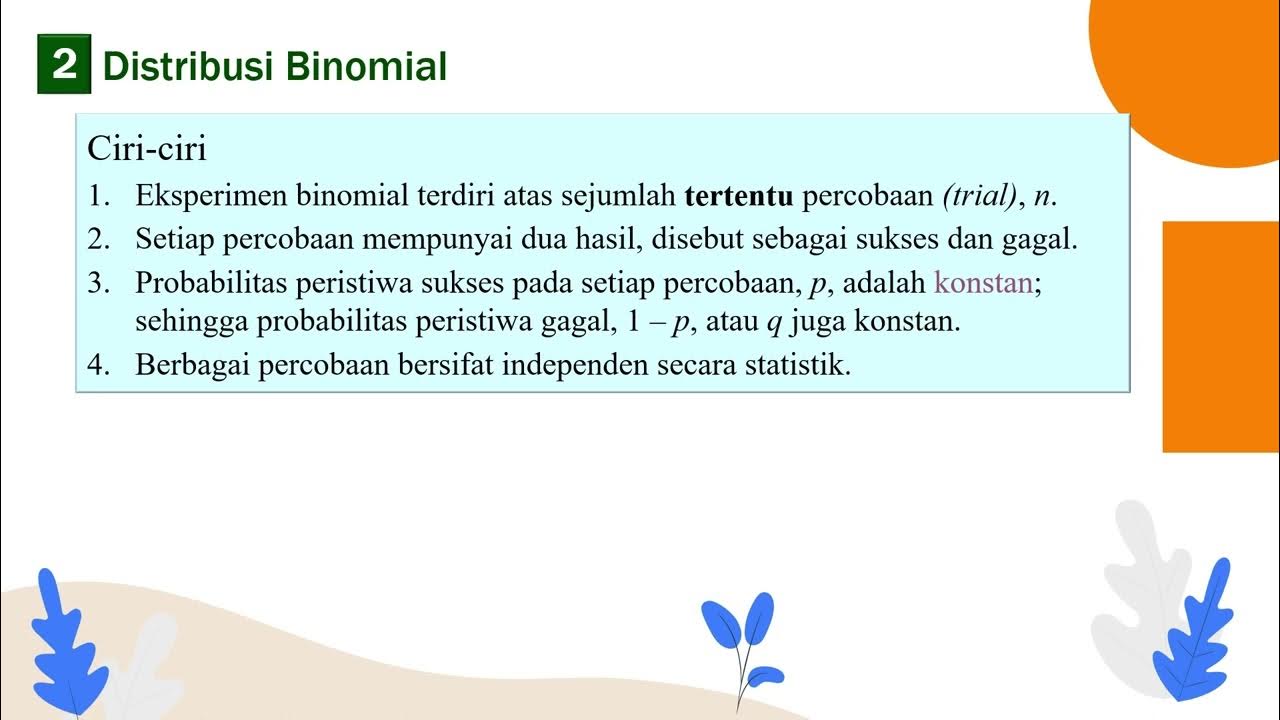
- 😀 The binomial experiment has two possible outcomes: defective or good products, and the trials are independent.
- 😀 Probability calculations for binomial distribution can be computed using Excel's `BINOM.DIST` function, either for individual or cumulative probabilities.
- 😀 To calculate the probability of having at most 3 defective products, sum the probabilities for 0, 1, 2, and 3 defective products.
- 😀 To calculate the probability of having more than 6 defective products, use the complement rule: 1 minus the cumulative probability for 0 to 6 defective products.
- 😀 The probability of having at least 45 defective products is equivalent to having at most 5 defective products, which can be computed by summing probabilities for 0 to 5 defective products.
- 😀 The Excel function `=BINOM.DIST(x, n, p, cumulative)` calculates individual or cumulative probabilities for a given number of defective products (x) in a sample size of n, with probability p.
- 😀 The Excel function `=BINOM.DIST.RANGE(n, p, x1, x2)` calculates the probability for a range of values, such as the probability of getting between 2 and 5 defective products in the sample.
- 😀 The lesson highlights how to use Excel to calculate binomial probabilities and introduces both the `BINOM.DIST` and `BINOM.DIST.RANGE` functions for different probability scenarios.
Q & A
What is the main concept being discussed in the video?
-The video discusses the binomial probability distribution, explaining its application through examples and how to compute probabilities using Excel functions.
What are the key characteristics of the binomial experiment in the script?
-The key characteristics are: 50 trials, two possible outcomes (defective or good product), constant probability of success (0.01), and independent trials.
Why is the sampling considered binomial in this case?
-The sampling is considered binomial because there are a fixed number of trials (50), two possible outcomes, a constant probability of success, and the trials are independent.
How does the video explain the relationship between the binomial distribution and coin flipping?
-The video compares the situation to flipping an unfair coin 50 times, where the probability of heads (success) is 0.01, to illustrate the concept of a binomial distribution.
What is the probability of having at most 3 defective products?
-The probability of having at most 3 defective products is the sum of the probabilities for 0, 1, 2, and 3 defective products, which equals 0.9984.
How is the probability of having more than 6 defective products calculated?
-The probability of having more than 6 defective products is calculated using the complement rule: 1 minus the probability of having 6 or fewer defective products, which equals approximately 0.0000001.
How is the probability of having at least 45 defective products calculated?
-The probability of having at least 45 defective products is calculated as the probability of having 5 or fewer defective products, which equals 0.99999.
What Excel function is used to calculate binomial probabilities?
-The Excel function used is the BINOM.DIST function. It can be used to calculate both individual and cumulative binomial probabilities by specifying the trial count (n), probability of success (p), and the number of successes (r).
What is the difference between calculating individual and cumulative probabilities using Excel?
-To calculate individual probabilities, the function uses 0 for the cumulative argument. For cumulative probabilities, the argument is set to 1, which includes all possibilities up to a specified number of successes.
How does the complement rule help in calculating binomial probabilities?
-The complement rule simplifies the calculation by subtracting the probability of the desired event from 1. This is particularly useful for finding the probability of outcomes such as 'more than X' defective products.
Outlines

This section is available to paid users only. Please upgrade to access this part.
Upgrade NowMindmap

This section is available to paid users only. Please upgrade to access this part.
Upgrade NowKeywords

This section is available to paid users only. Please upgrade to access this part.
Upgrade NowHighlights

This section is available to paid users only. Please upgrade to access this part.
Upgrade NowTranscripts

This section is available to paid users only. Please upgrade to access this part.
Upgrade NowBrowse More Related Video

Sesi 5 3 Distribusi Probabilitas Bagian 3

Review: Sampling Distribution of the Sample Proportion, Binomial Distribution, Probability (7.5)

Binomial distribution # Explanation with notes# Properties of binomial distribution.

Distribusi Probabilitas Binomial | Matematika Peminatan Kelas 12

Distribusi Binomial • Part 6: Contoh Soal Distribusi Peluang Variabel Acak Diskrit (3)

Poisson Distribution | Theory with examples
5.0 / 5 (0 votes)